The problem
SMS and email gave people little say over which alerts they got and from where, and SMS was costly for INSO
An alert by SMS or email already said what happened, where and what to do. What people couldn't do was shape what reached them.
Only whole regions. Each NGO has one or two people managing its INSO account in the Partners Portal, a web application used on a laptop. They activate regions for teams, so a team in the south only gets alerts from the south. Nothing finer than a region existed: no area around you, no route, no single compound.
Costly, and easy to miss. SMS was also getting expensive for the country offices, and alerts got lost among every other SMS and email.
Composing and sending meant a laptop. INSO staff wrote and sent alerts from a laptop through the same system, which is hard from the field and sometimes impossible.
In some regions SMS and email were, and still are, the only way, so the app is an alternative, not a replacement. It brings both sides into one place: composing and sending alerts, and seeing how they appear in the feed. Teams still only see the regions activated for them, and can now choose which of those they're notified about from the app's settings, then narrow down further with the map modes, to an area, a radius or an exact shape.
Users
Three groups, one sending and two receiving
Receive – user groups
| Who | Needs | Pains before the app |
|---|---|---|
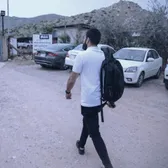 NGO field workersIn the field, on the move, exposed to risk, sometimes with no internet | Stay updated while movingFocus only on what affects their safety: the road, where they're going, where they sleep | Only whole regions, activated by their NGO's account admin on a laptopAlerts lost among every other SMS and email |
 Security and operations staffIn an office, keeping an eye on teams who travel, advising them by SMS or a call | Monitor specific areas remotelyTrack patterns and ongoing situations | Couldn't follow a place they weren't inNo radius or custom area, like the compound where staff live |
SharedBoth groups | Quickly understand what's happening nearbyTrust the accuracy of alertsStay updated in real time | High pressure, little time to readUnclear alerts reduce trustPhone checks are a security risk |
Send – user group
| Who | Needs | Pains before the app |
|---|---|---|
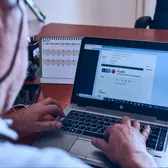 INSO staff in the country officesCollect, validate, compose and send the alerts | Compose and send quickly, from anywhere, with or without dataReduce the cost of SMS | Composing and sending meant a laptop and the Partners Portal, hard from the fieldSMS was costly |
Where I came in
A first version existed, and I came in to bring some structure
The app started as an initiative from the engineers. Its features came from conversations with country office colleagues about what could be useful, so they were tied to real needs, but none of it was documented or tested. In a nonprofit, where nobody is chasing activation and retention, something people can use is already better than nothing, so the team had built what felt useful and shipped it.
I joined to support the team. What first caught my eye was that it didn't look like INSO, with brown and beige everywhere and no INSO blue. But the more I looked, the more I wanted to put some structure around the problem itself.
Before
That structure had limits. I was the only designer, with two other projects on my plate, and I couldn't reach partners, the actual end users, so country office colleagues stood in for them. I couldn't do research the traditional way, so I had to be realistic about where I could help: taking things from the first version that worked, even without data, and checking the rest through a heuristic evaluation, interviews and Maze tests with country office colleagues, then a survey with partners after launch. I decided to focus on design principles instead of a full research phase, and there would be no baseline to compare against.
Not having that structure showed later. INSO staff, the senders, were left out of the first round because nobody had talked to them about their needs and weighed them against the others. Nobody objected, but sending came back later as a patch, and so did a few other things.
Login
Users were asked to act before understanding what the app does
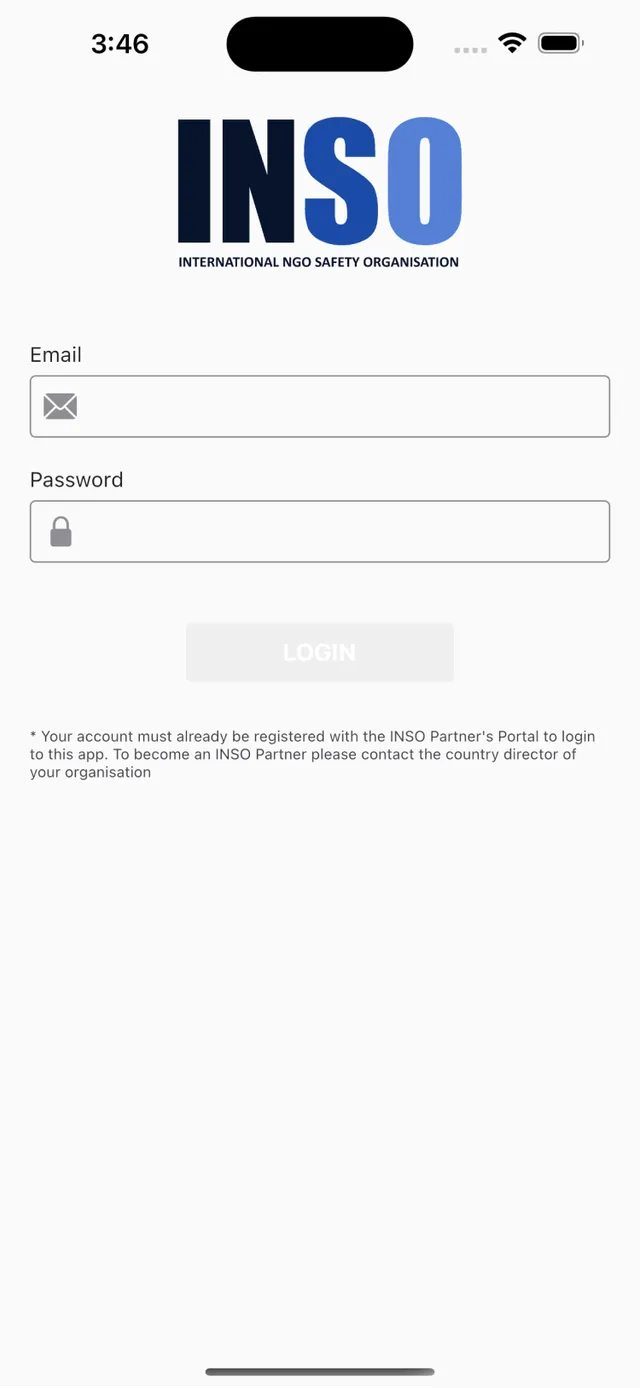
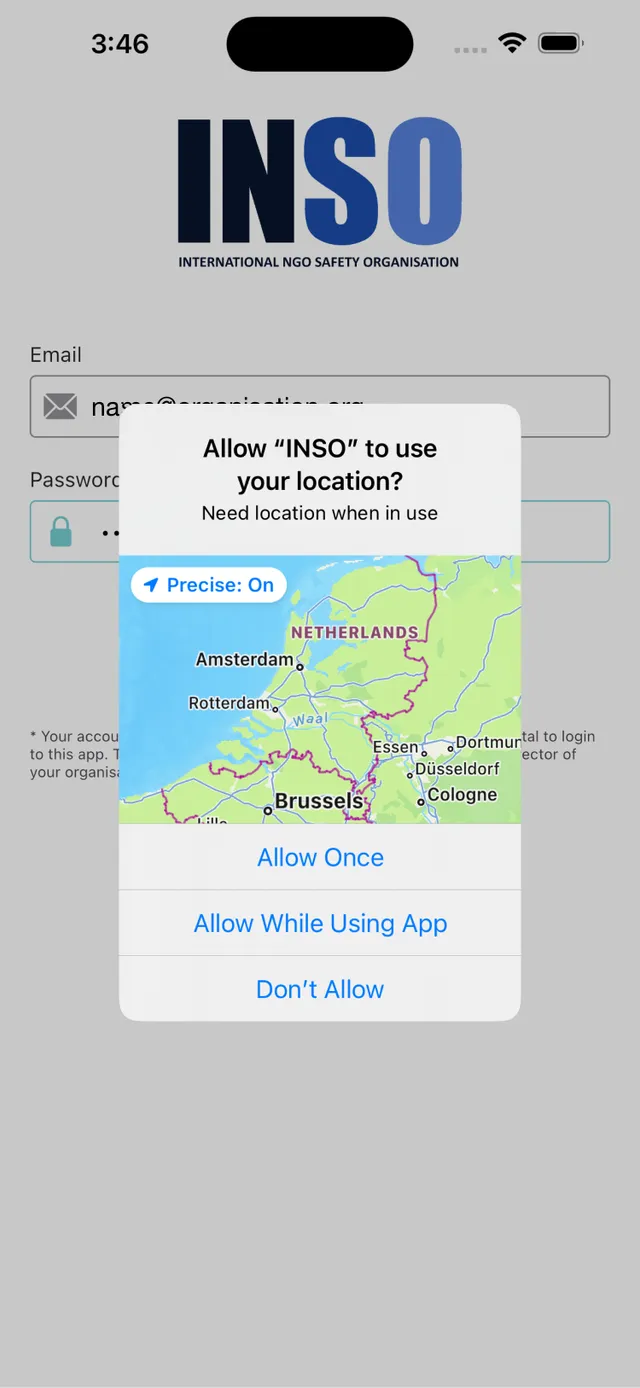
A quick heuristic evaluation of the startup and login screen turned up a few serious problems. The app opened straight on a login form and asked for location access before anyone had logged in, with no hint of why. It never said what the app was for. The login itself was hard to use too, with a barely visible button, an "Invalid email" error before anyone had typed, how to get an account explained in a tiny note, and no way to reset a password. Country office colleagues believed a welcome email would be enough to explain things, but someone could install the app today and only open it a month later when an alert comes in, and by then that email is long gone. So the explanation had to live inside the app.
Explain first, ask for location later
Here is how I approached each of the main problems from my heuristic evaluation of the startup and login screen.
| Problem | Solution |
|---|---|
| Location access was asked first, before anyone had logged in and with no explanation | Location access is now asked only after, once people know what it's for |
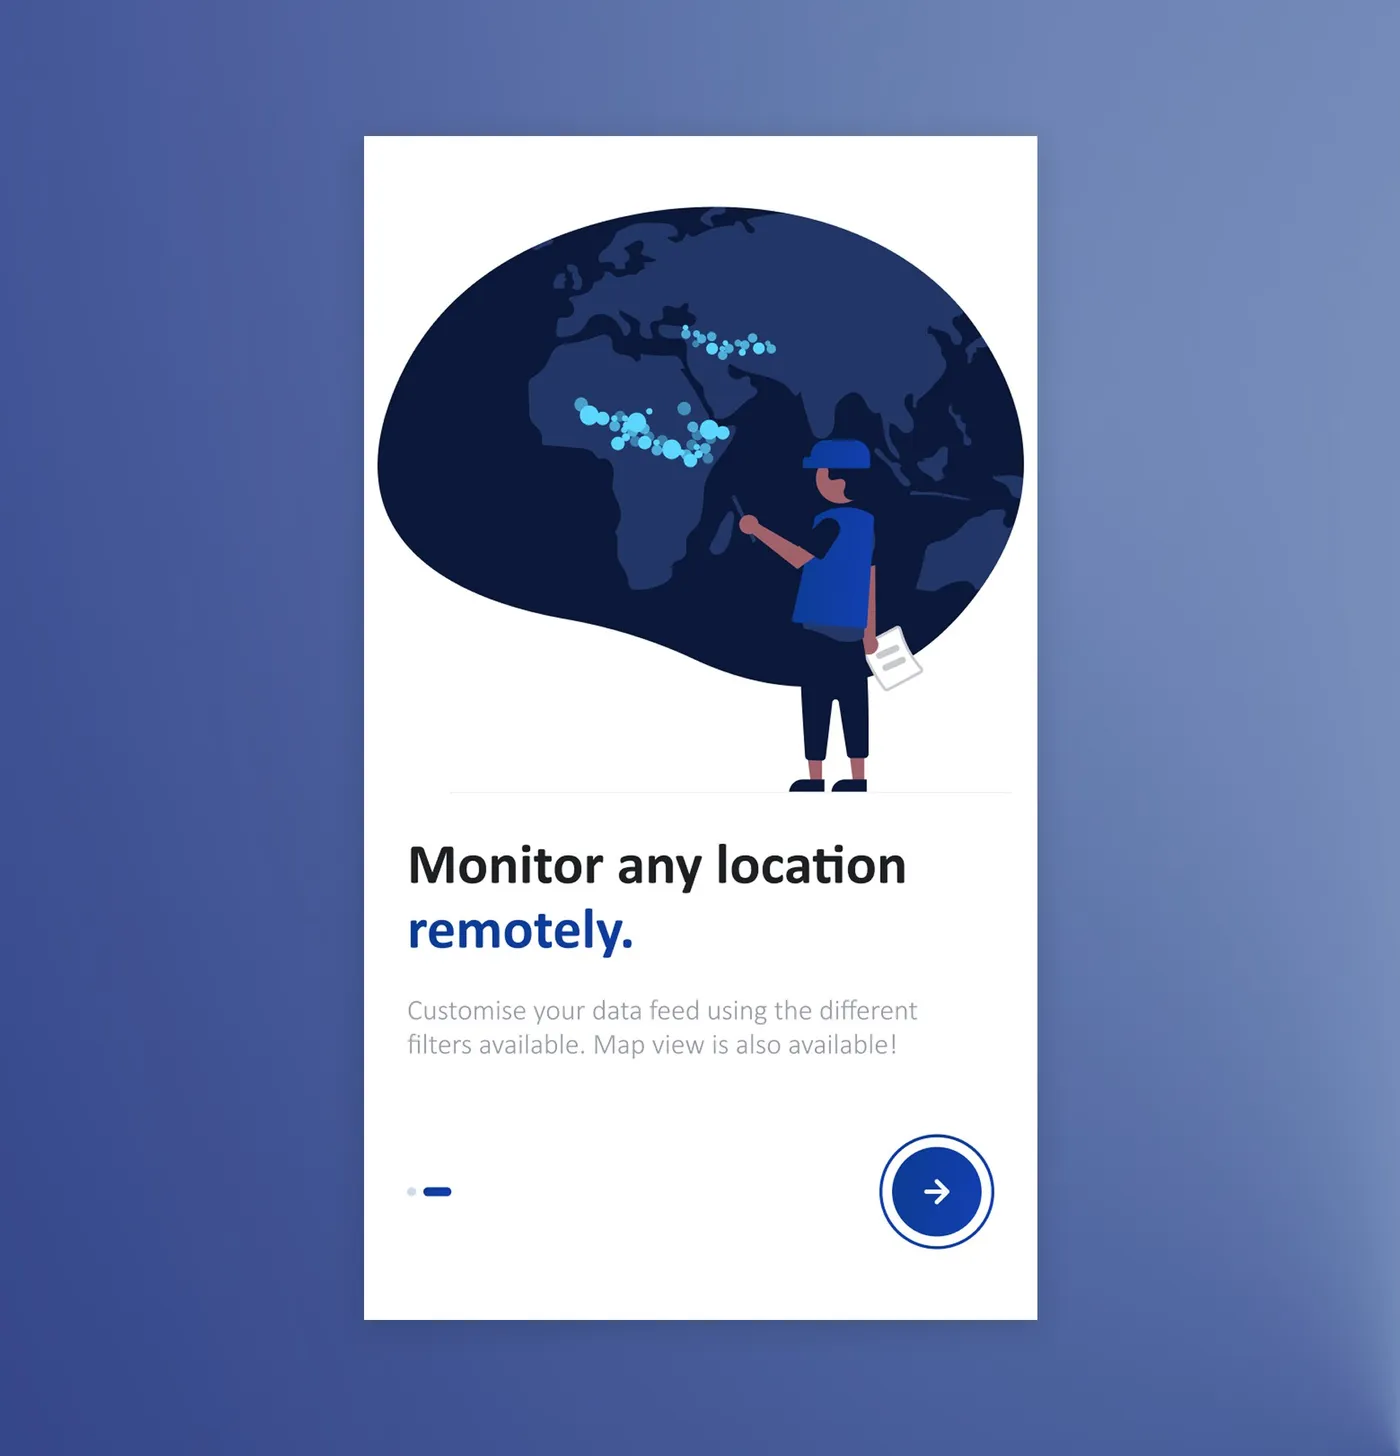
| The app never said what it was for | Two short onboarding screens now come before the login |
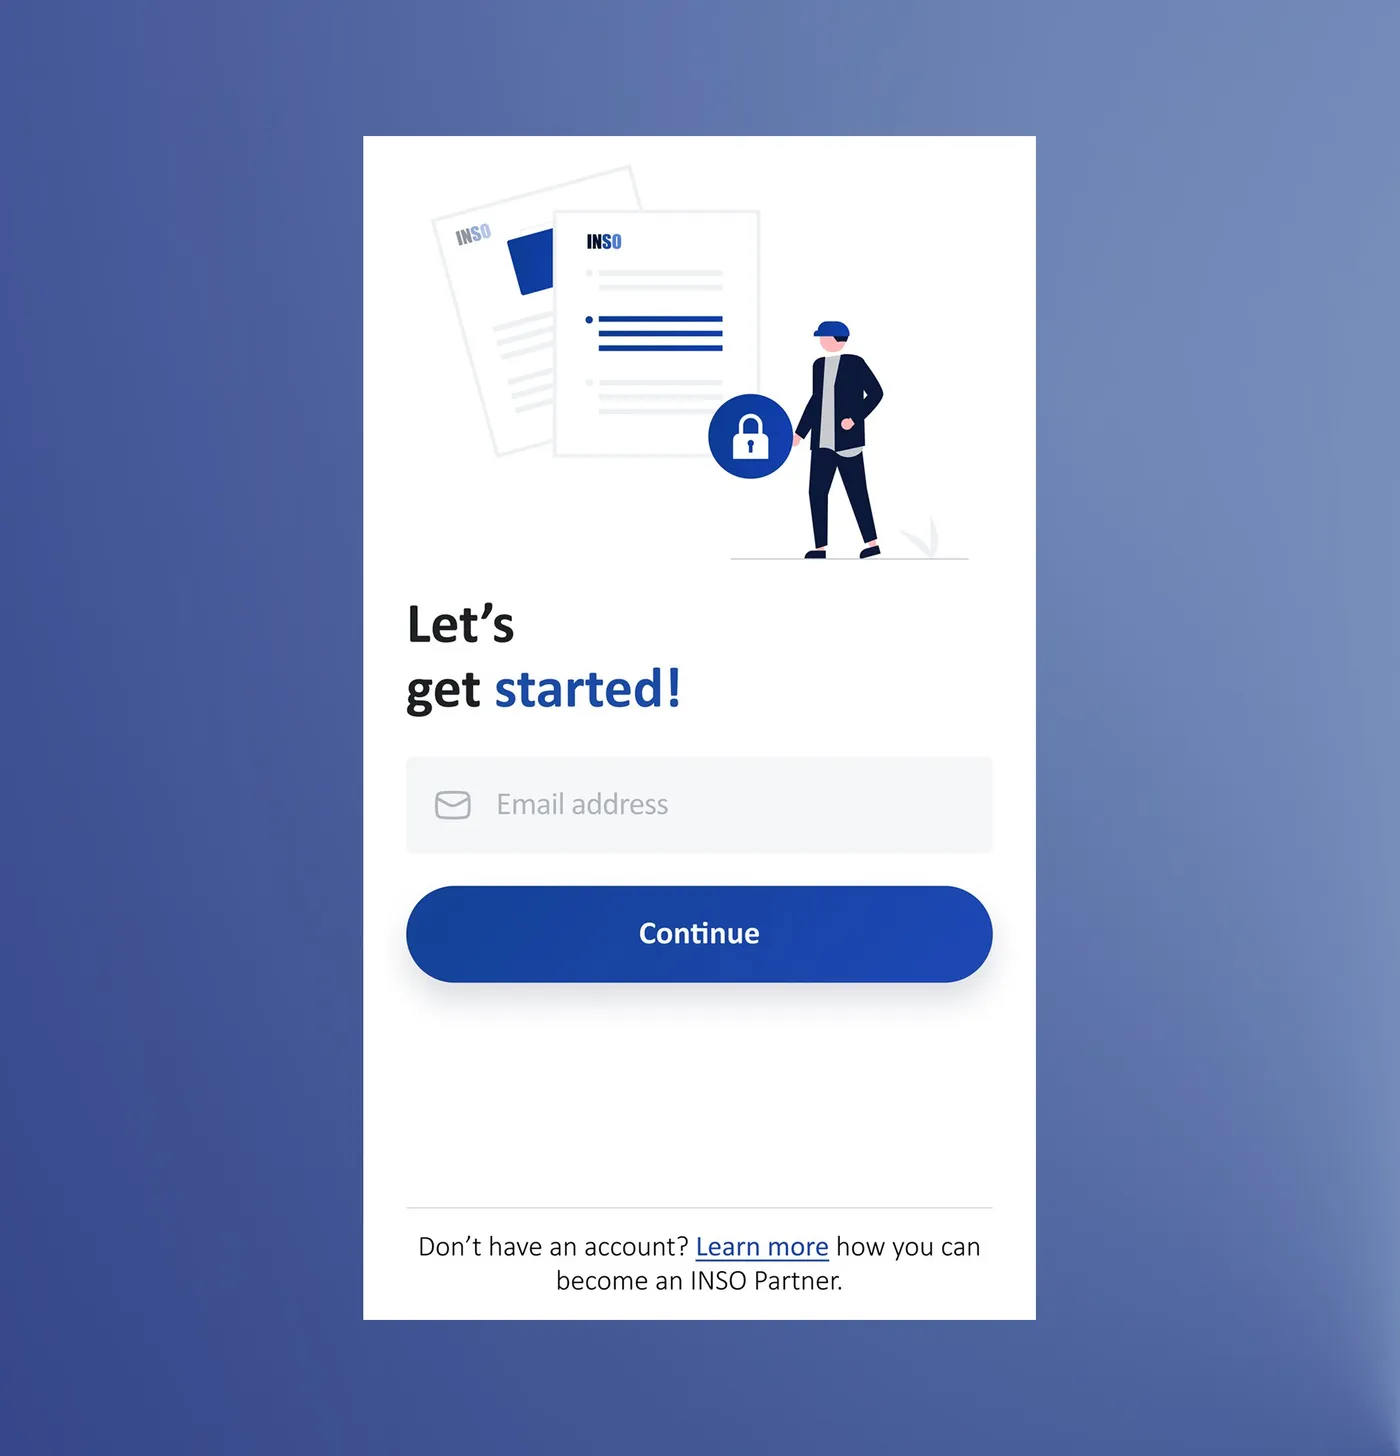
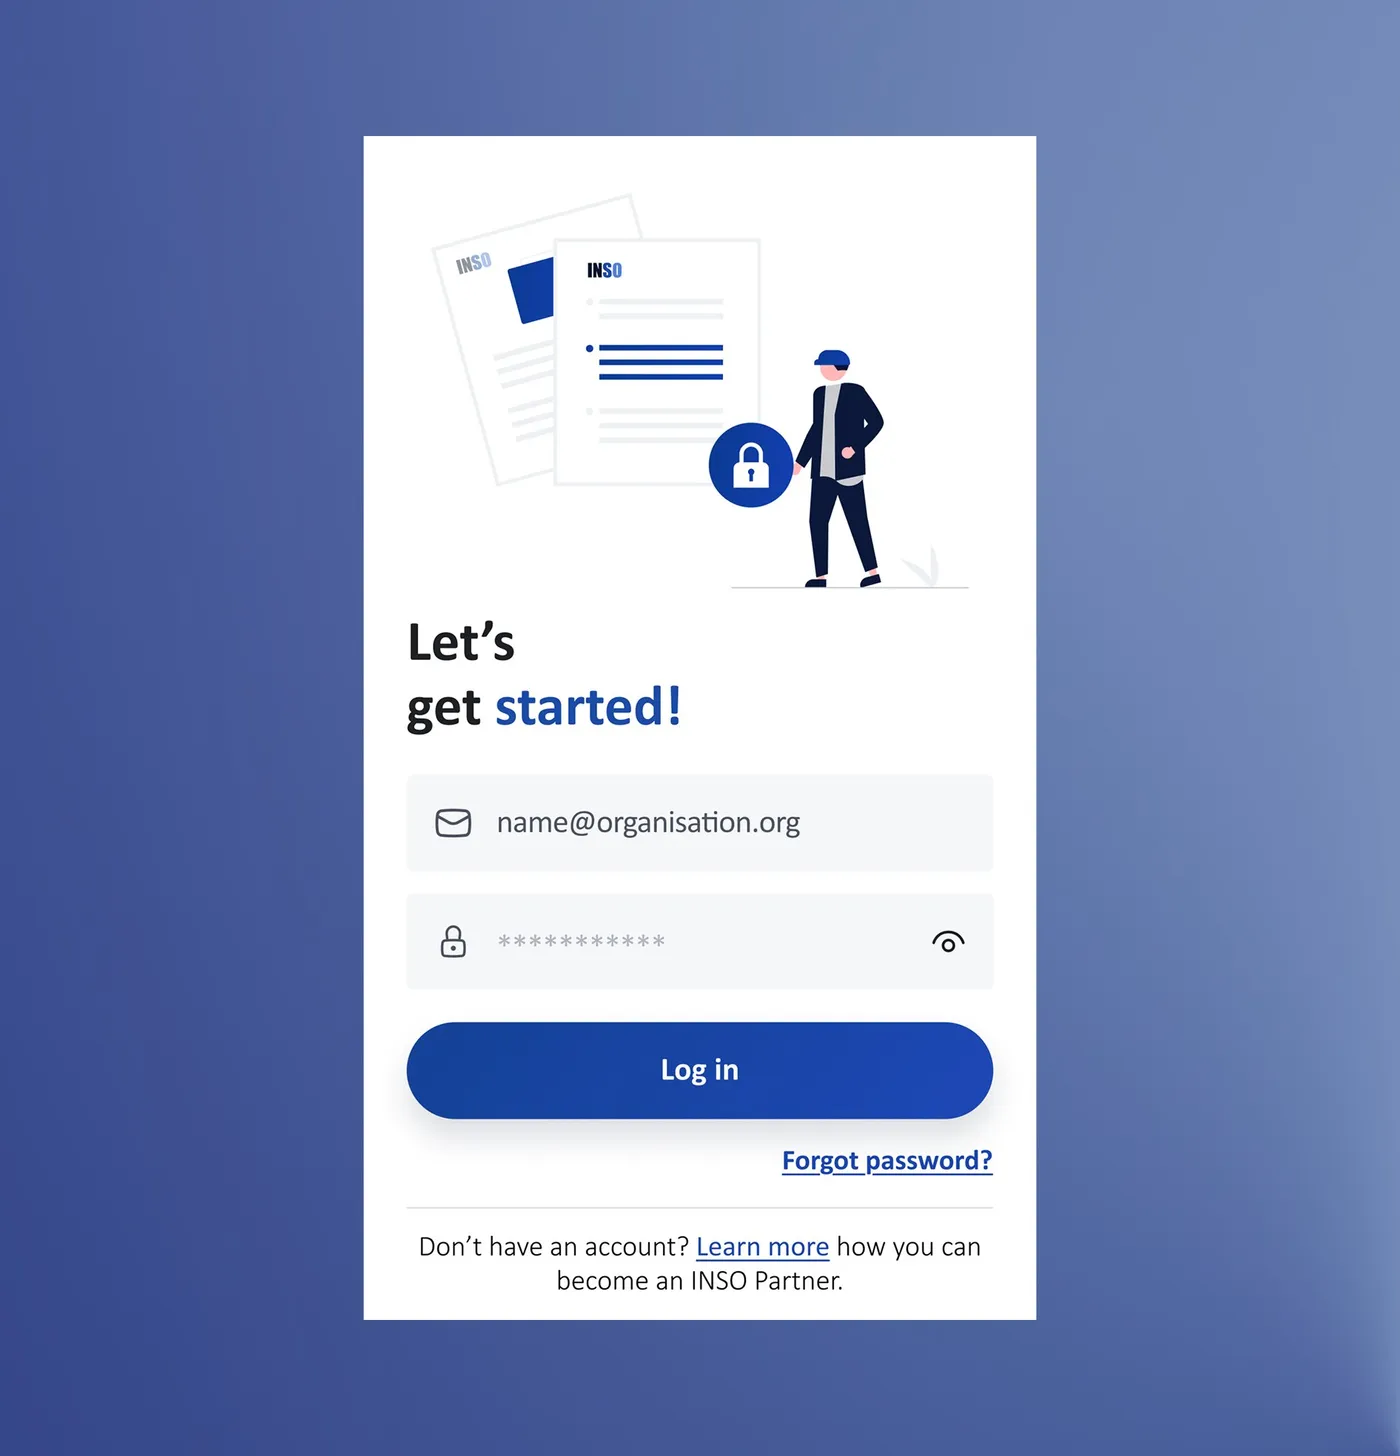
| The login button was barely visible, and "Invalid email" showed before anyone had typed | The login got the brand back. It starts with just an email and a clear Continue button, and the validation stopped shouting "Invalid email" before anyone had typed a thing |
| How to get an account was a tiny note, and there was no way to reset a password | "Don't have an account? Learn more" now sits under the form in readable text and leads to the registration page on ngosafety.org, with a "Forgot password?" link and a show/hide toggle on the password |

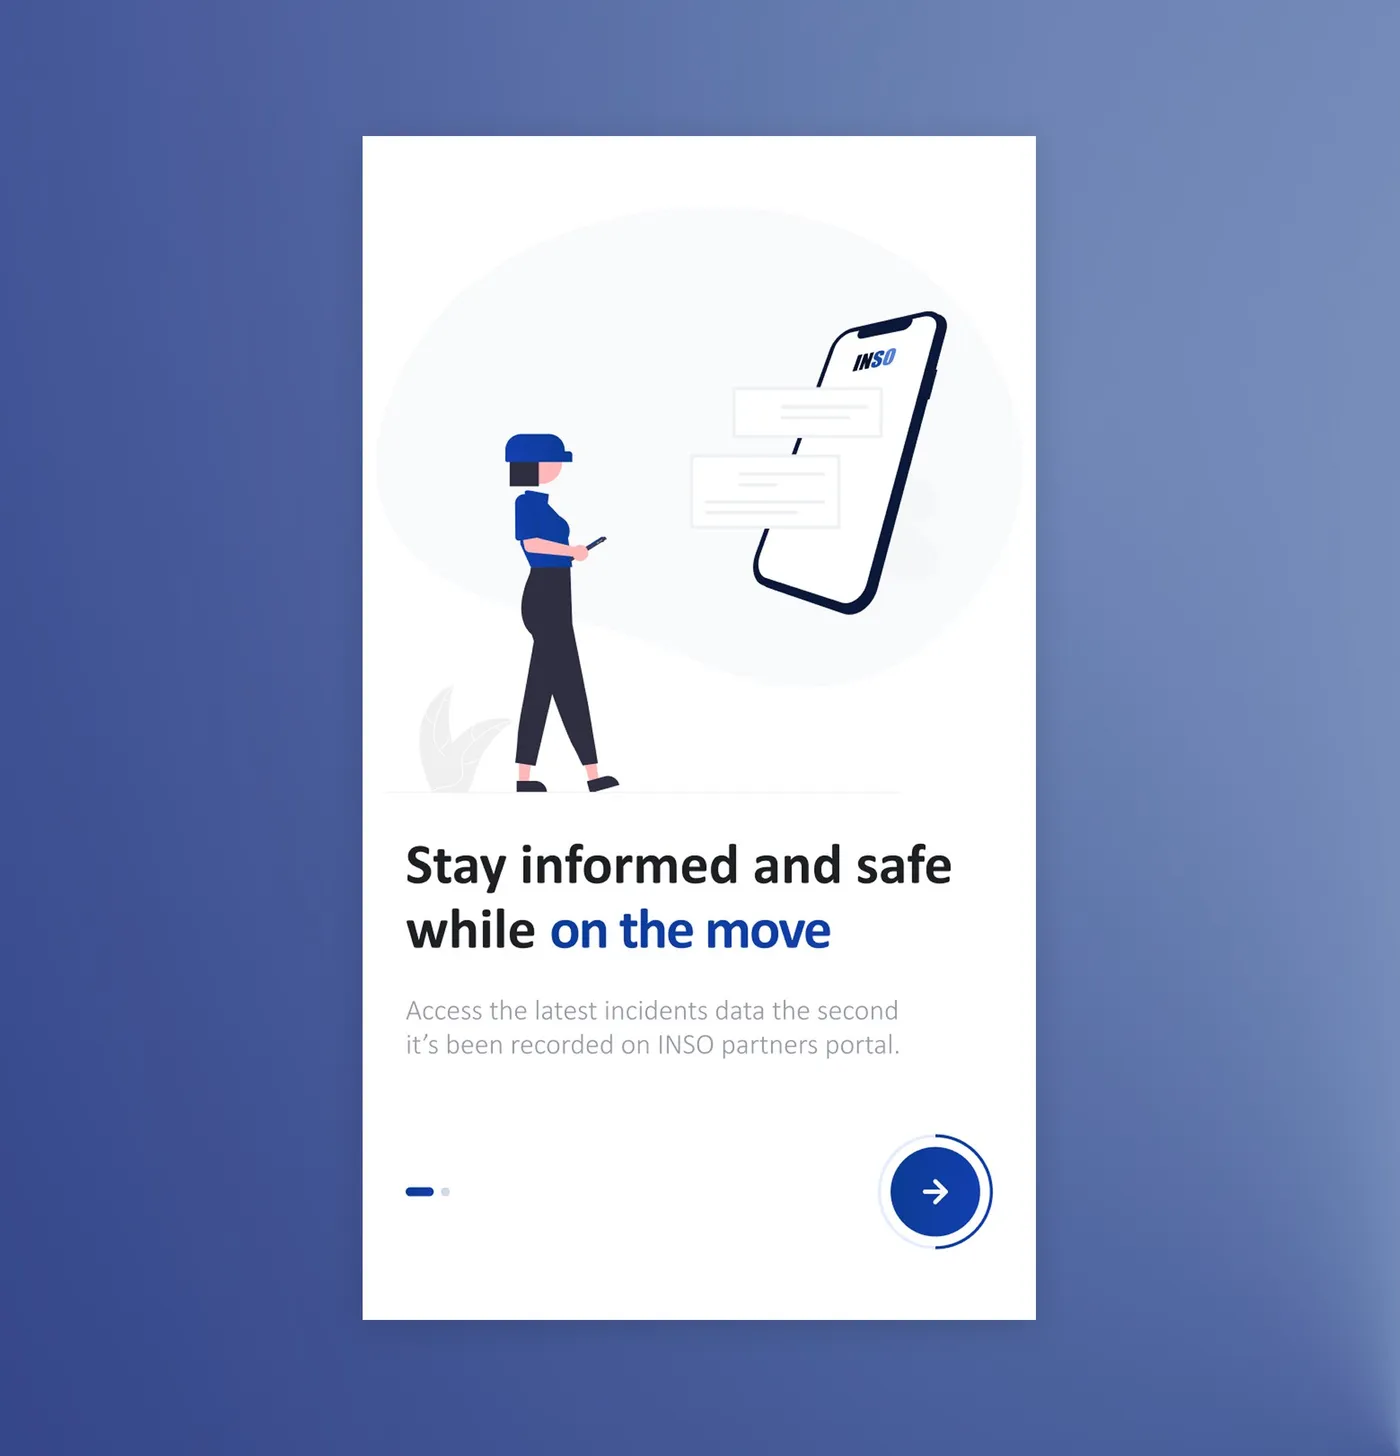
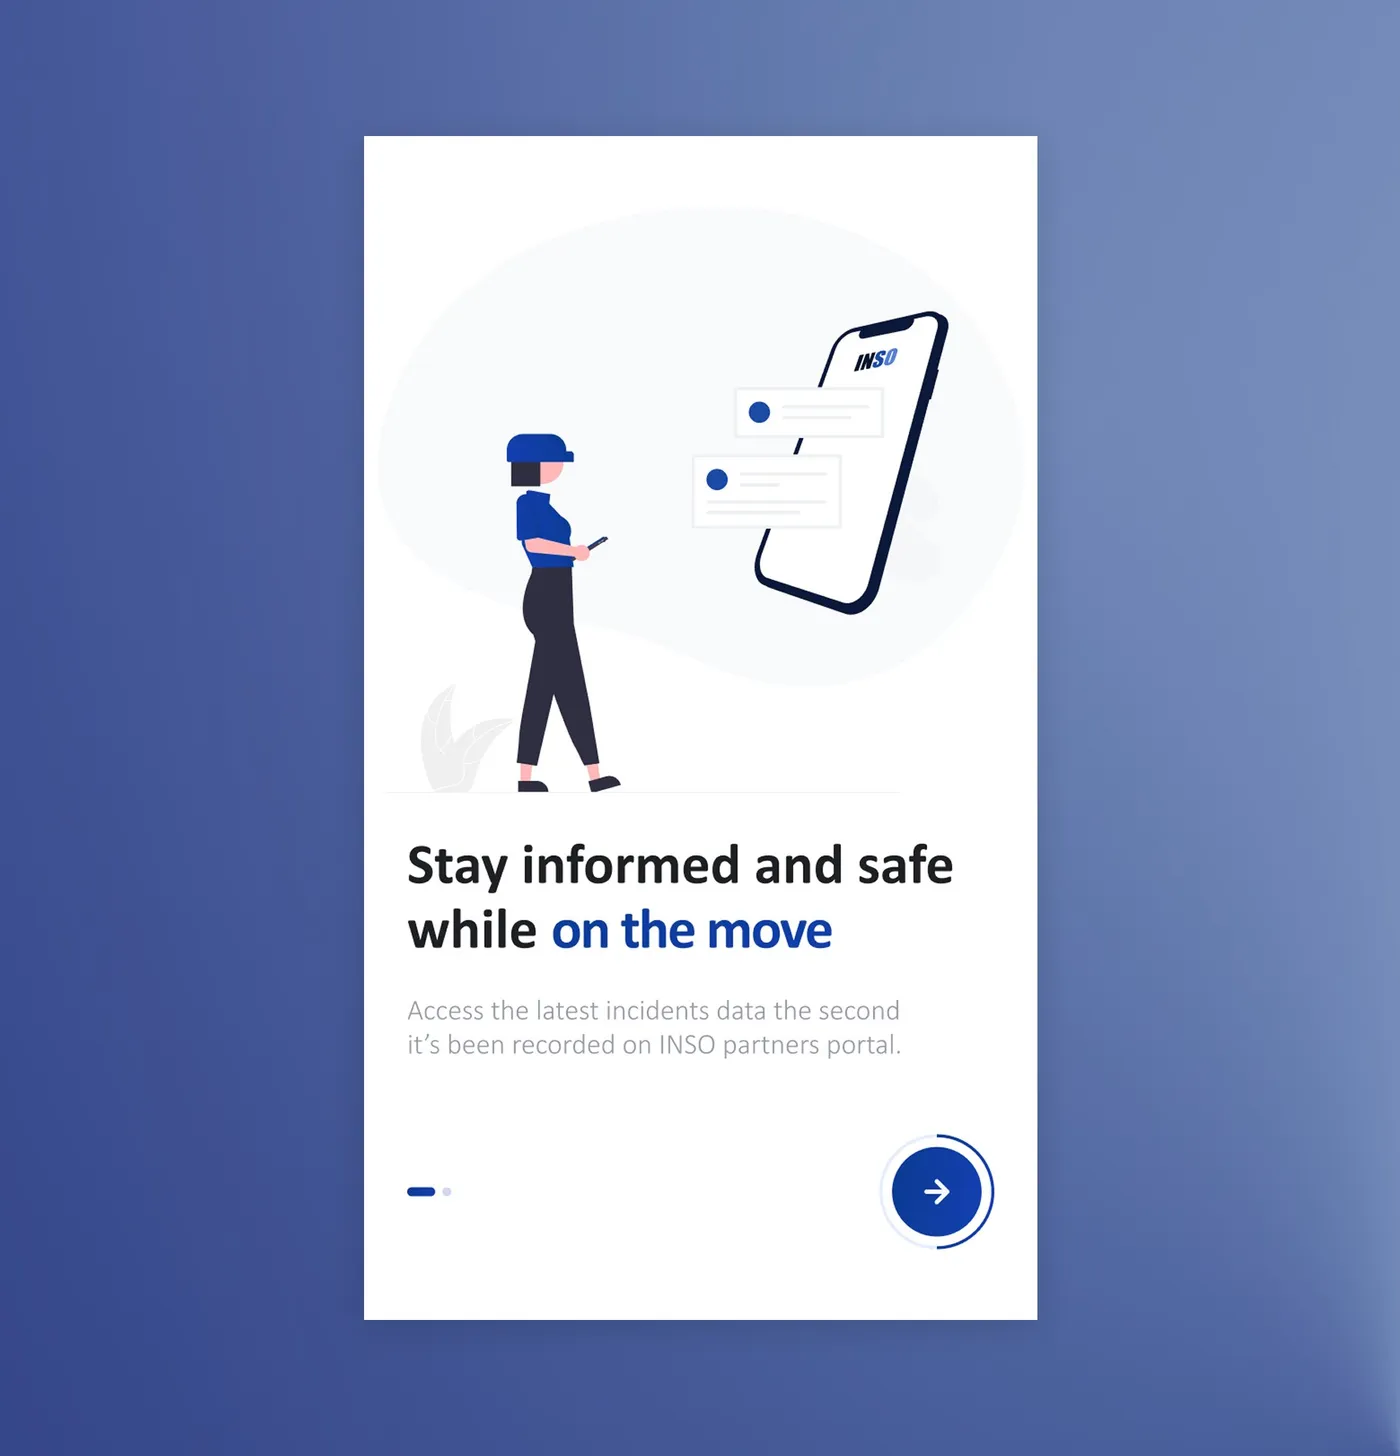
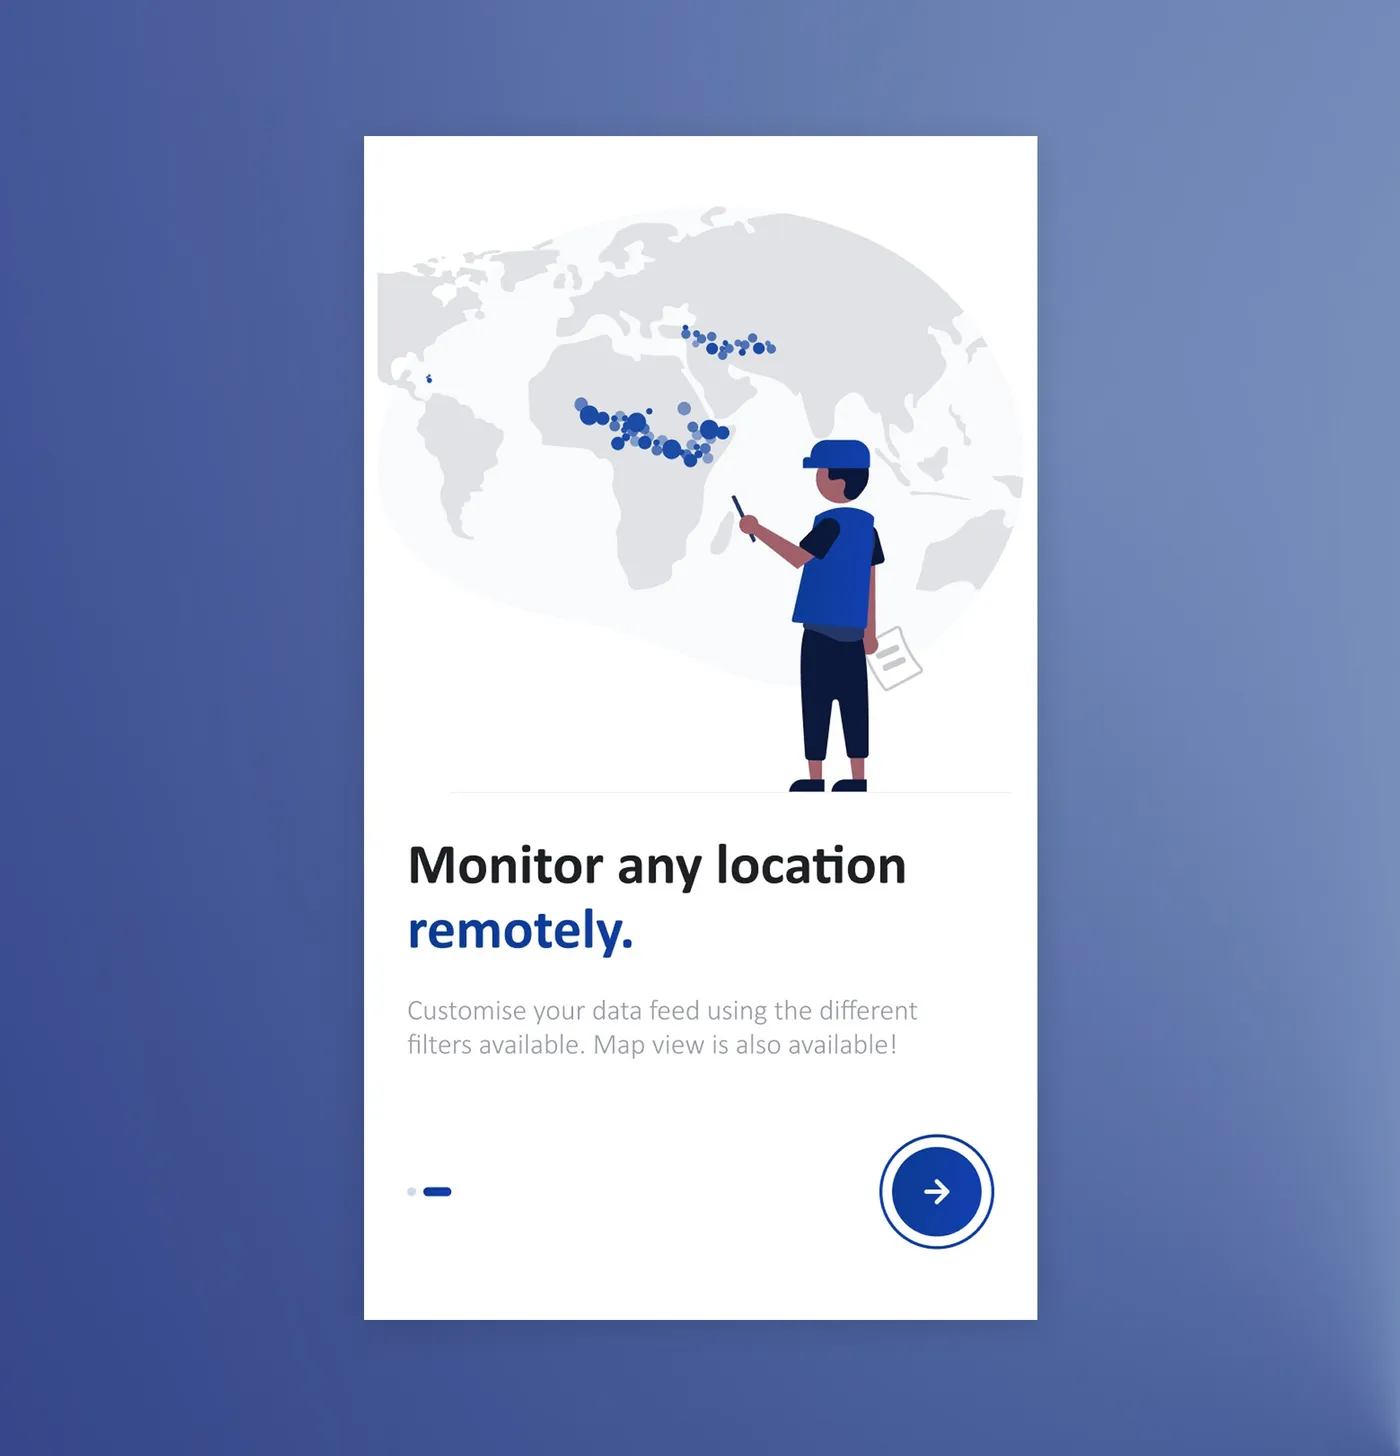
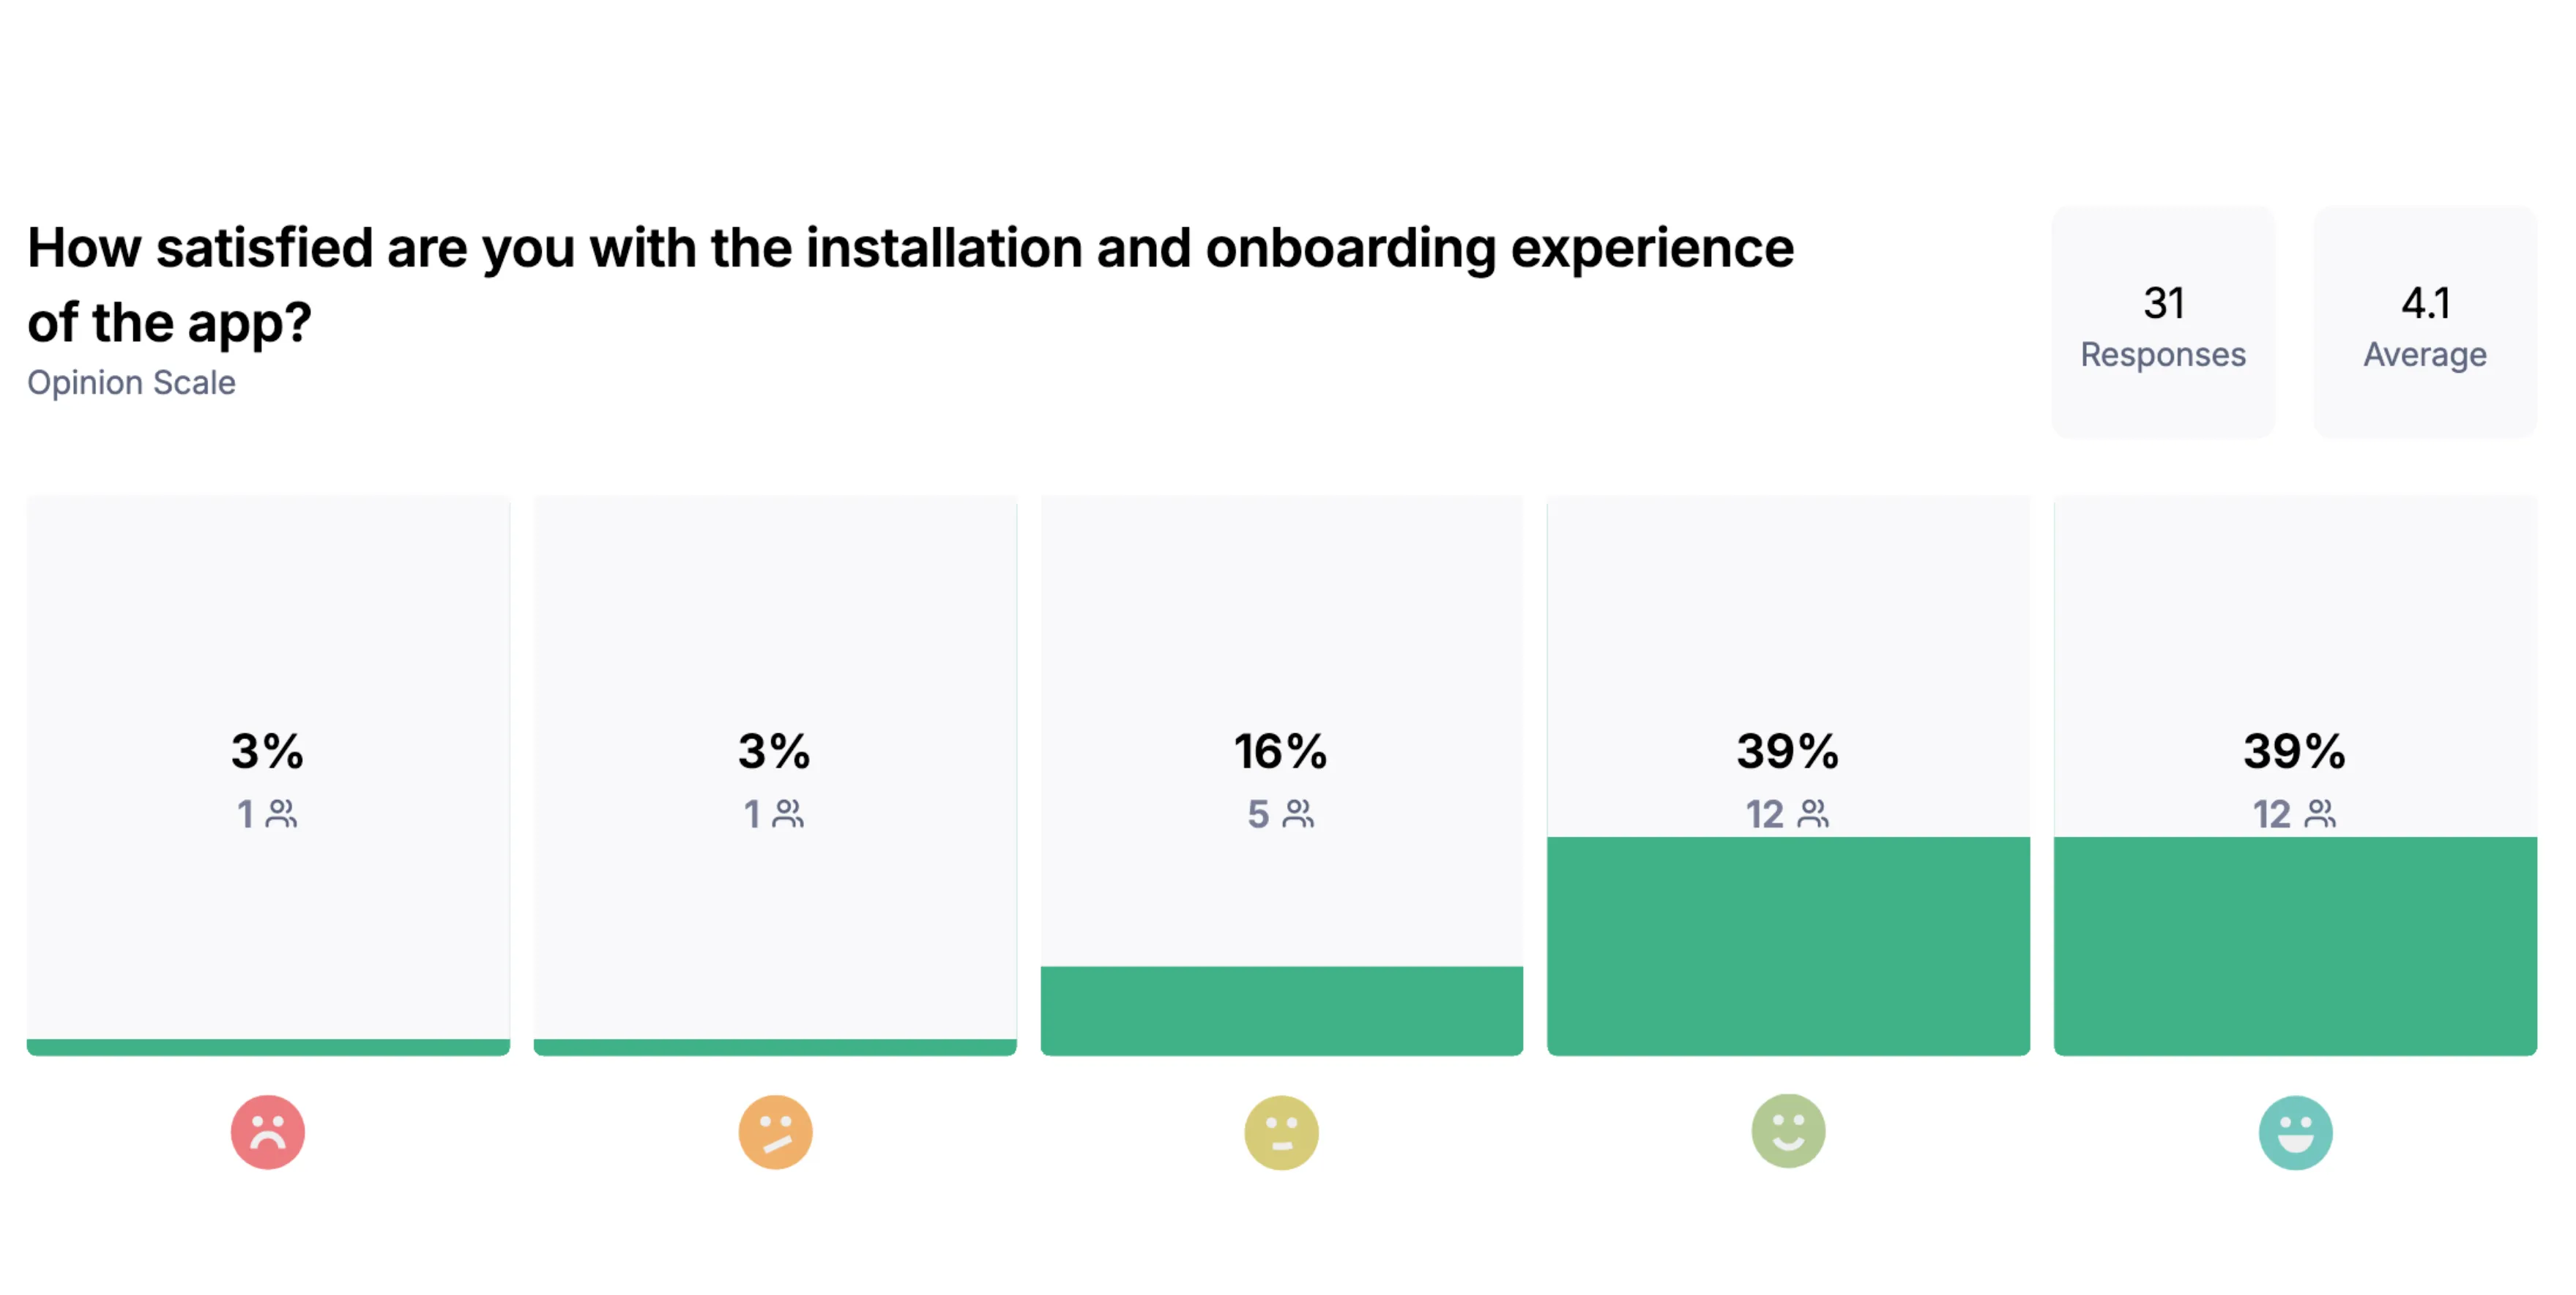
Most partners found getting started easy.
24 of 31 rated installation and onboarding 4 or 5 out of 5 (average 4.1/5) · post-launch partner survey · no baseline for the old version
Alerts
The main screen had all the information, but it was hard to read and scan
Eight alerts squeezed on one screen
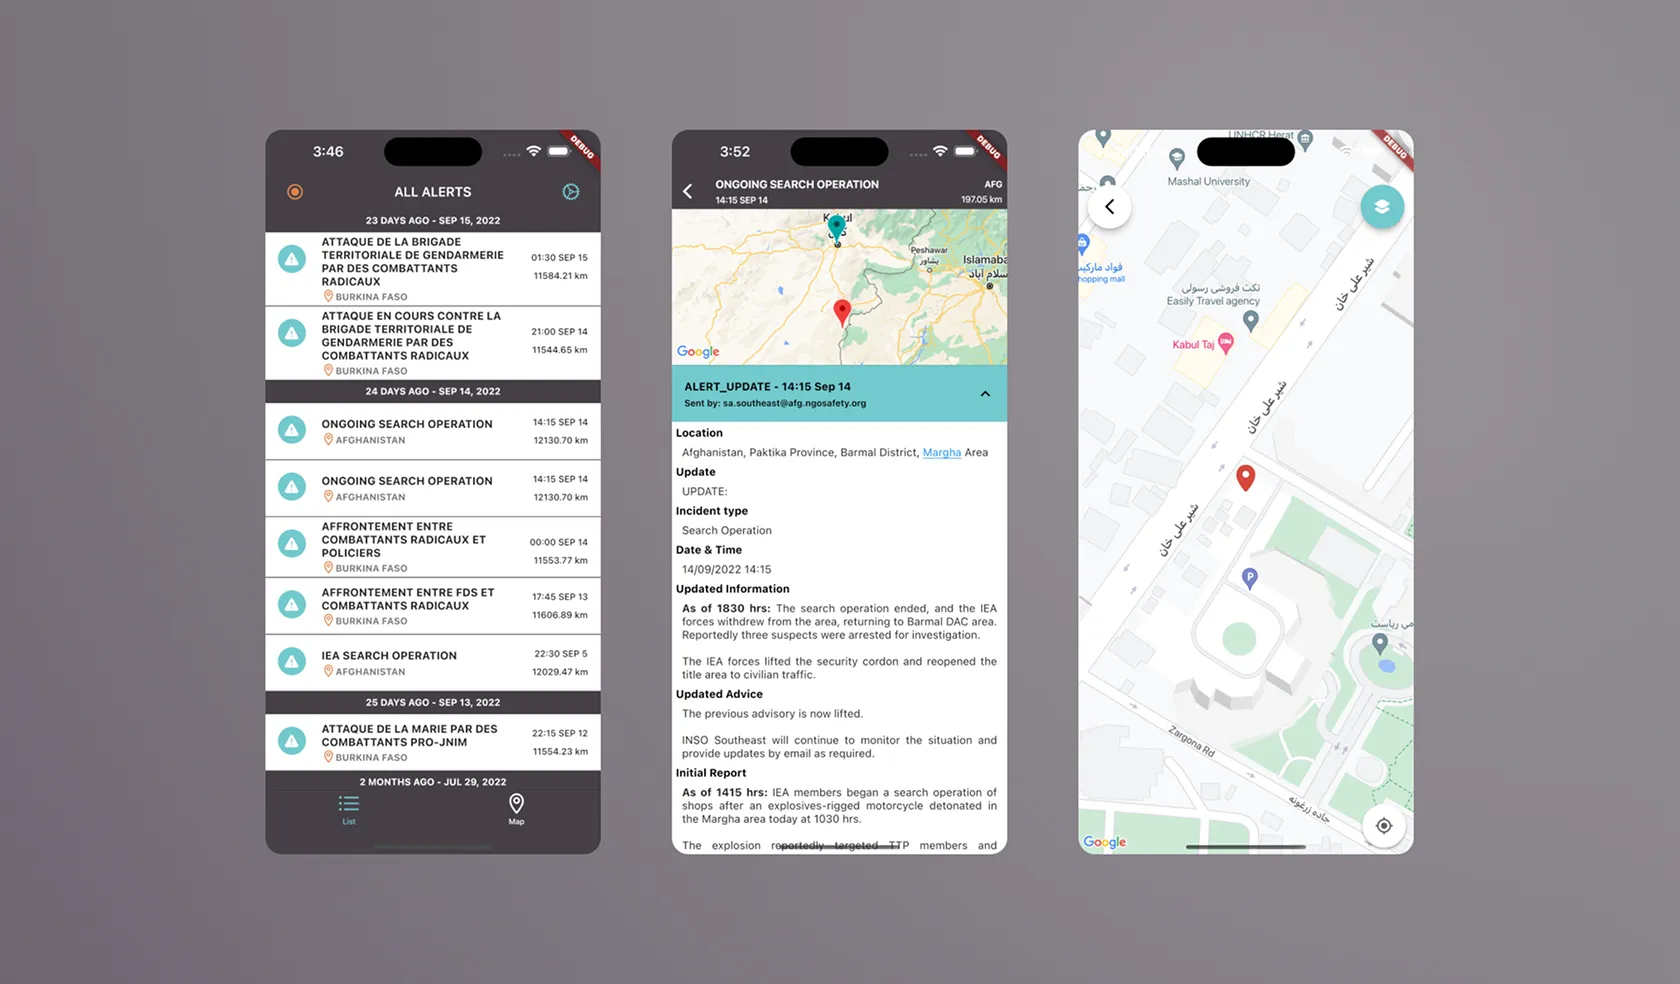
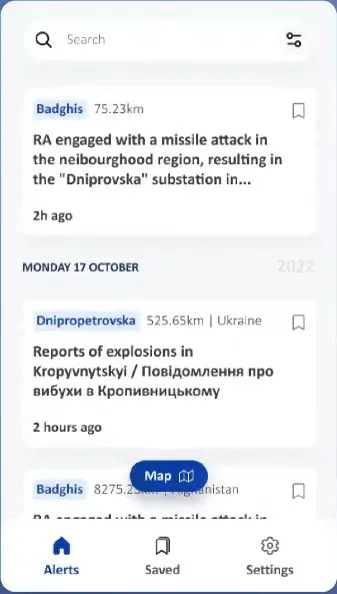
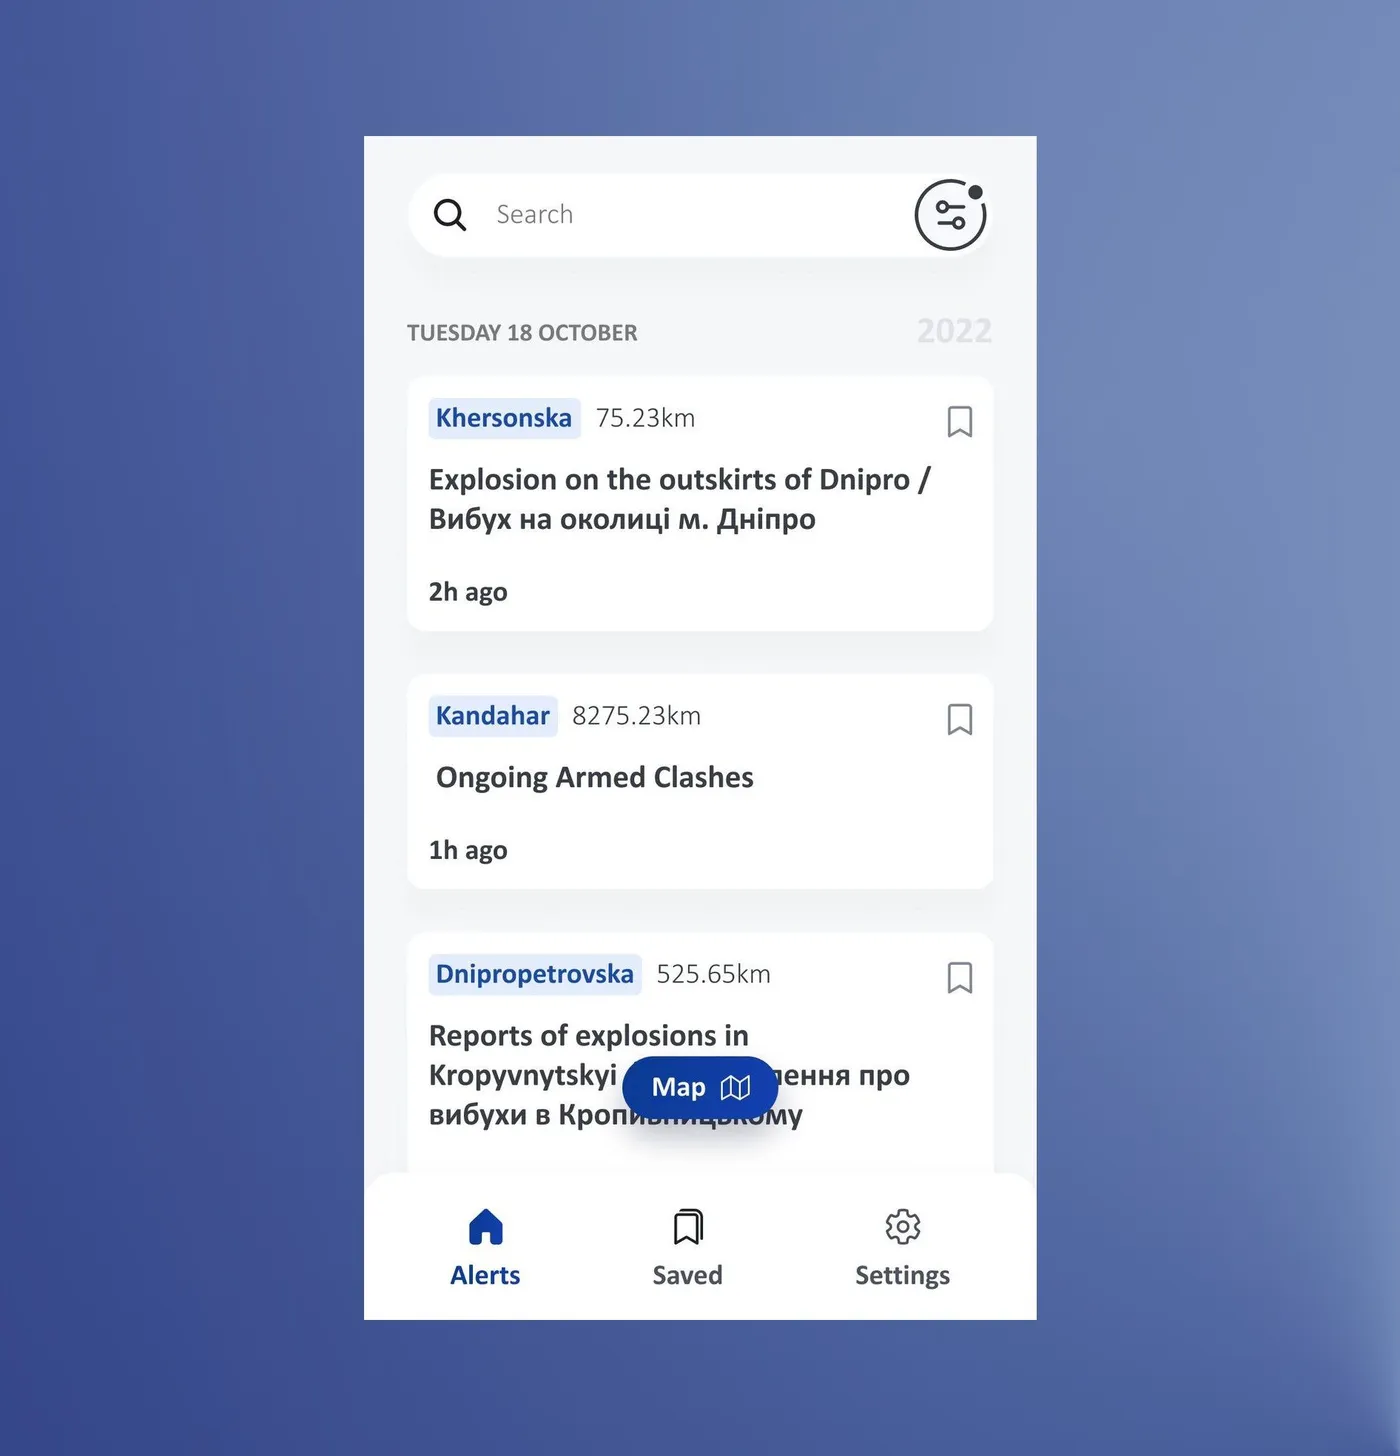
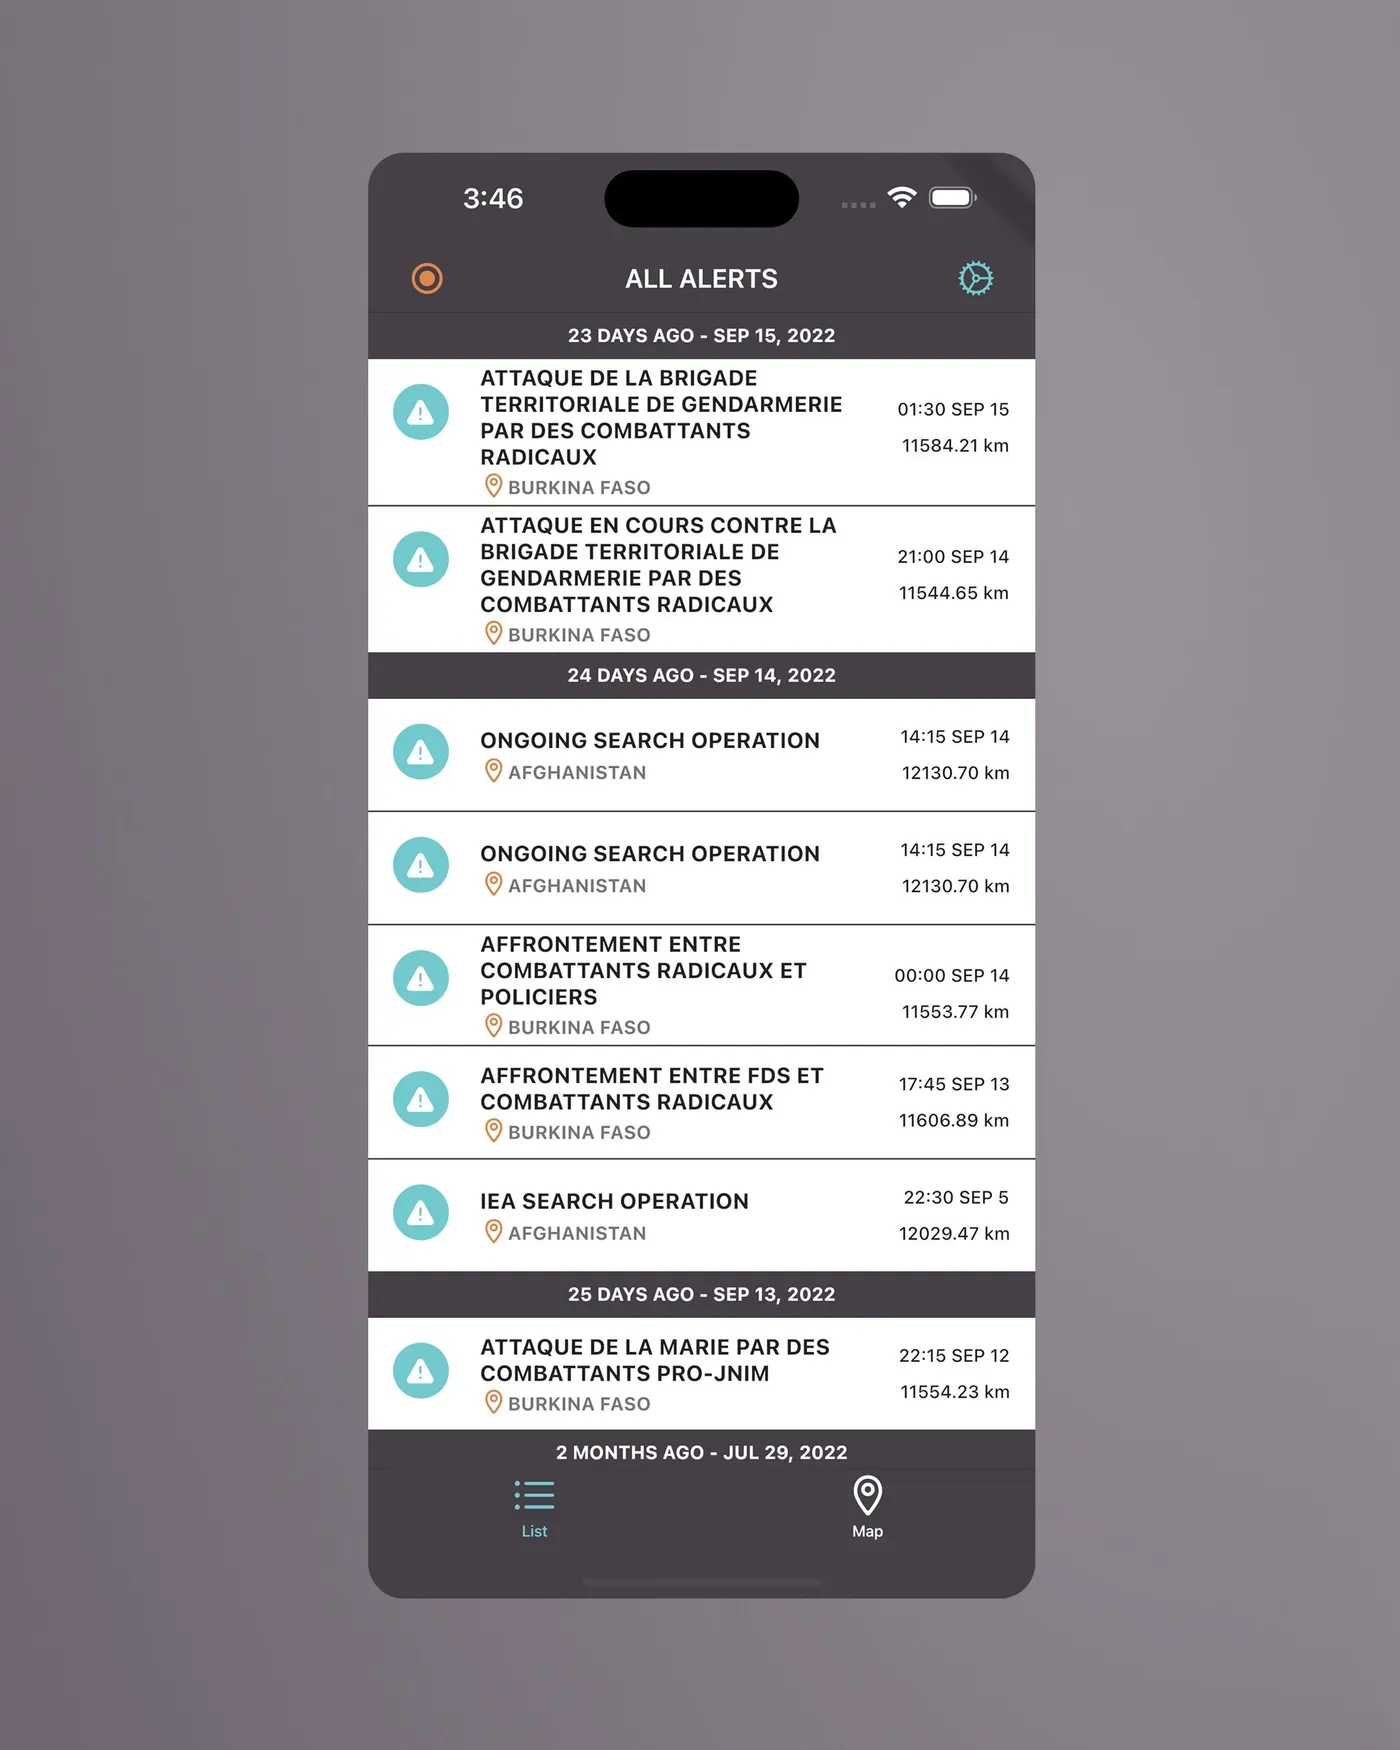
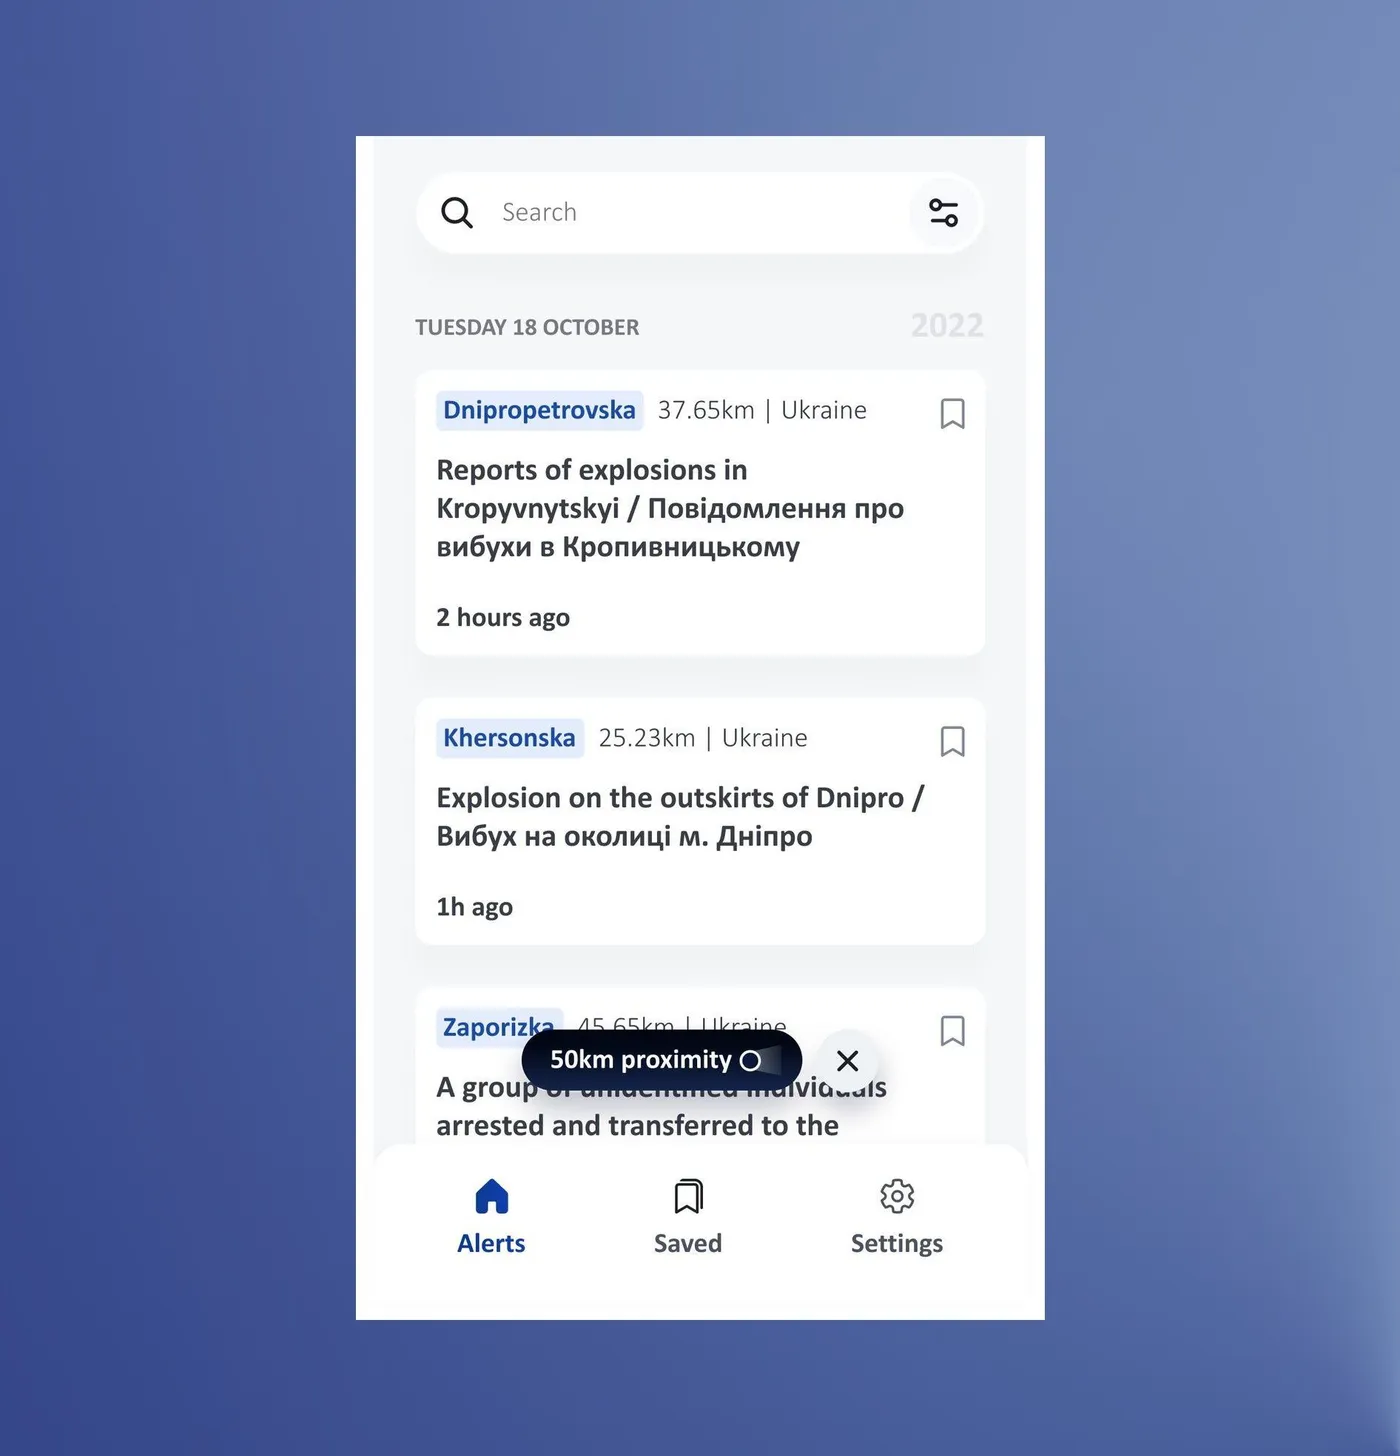
Eight alerts were squeezed on one screen, with titles of 12 to 16 words in a tiny column and small dates and distances fighting for attention. The engineers' idea was to show as much as possible without scrolling, so the question became: see everything at once, or read each alert easily? My first thought was "where should I be looking?" There was no way to search by place either, and no profile or way to reach terms, FAQs or info about the app, just a settings icon at the top right.
Before
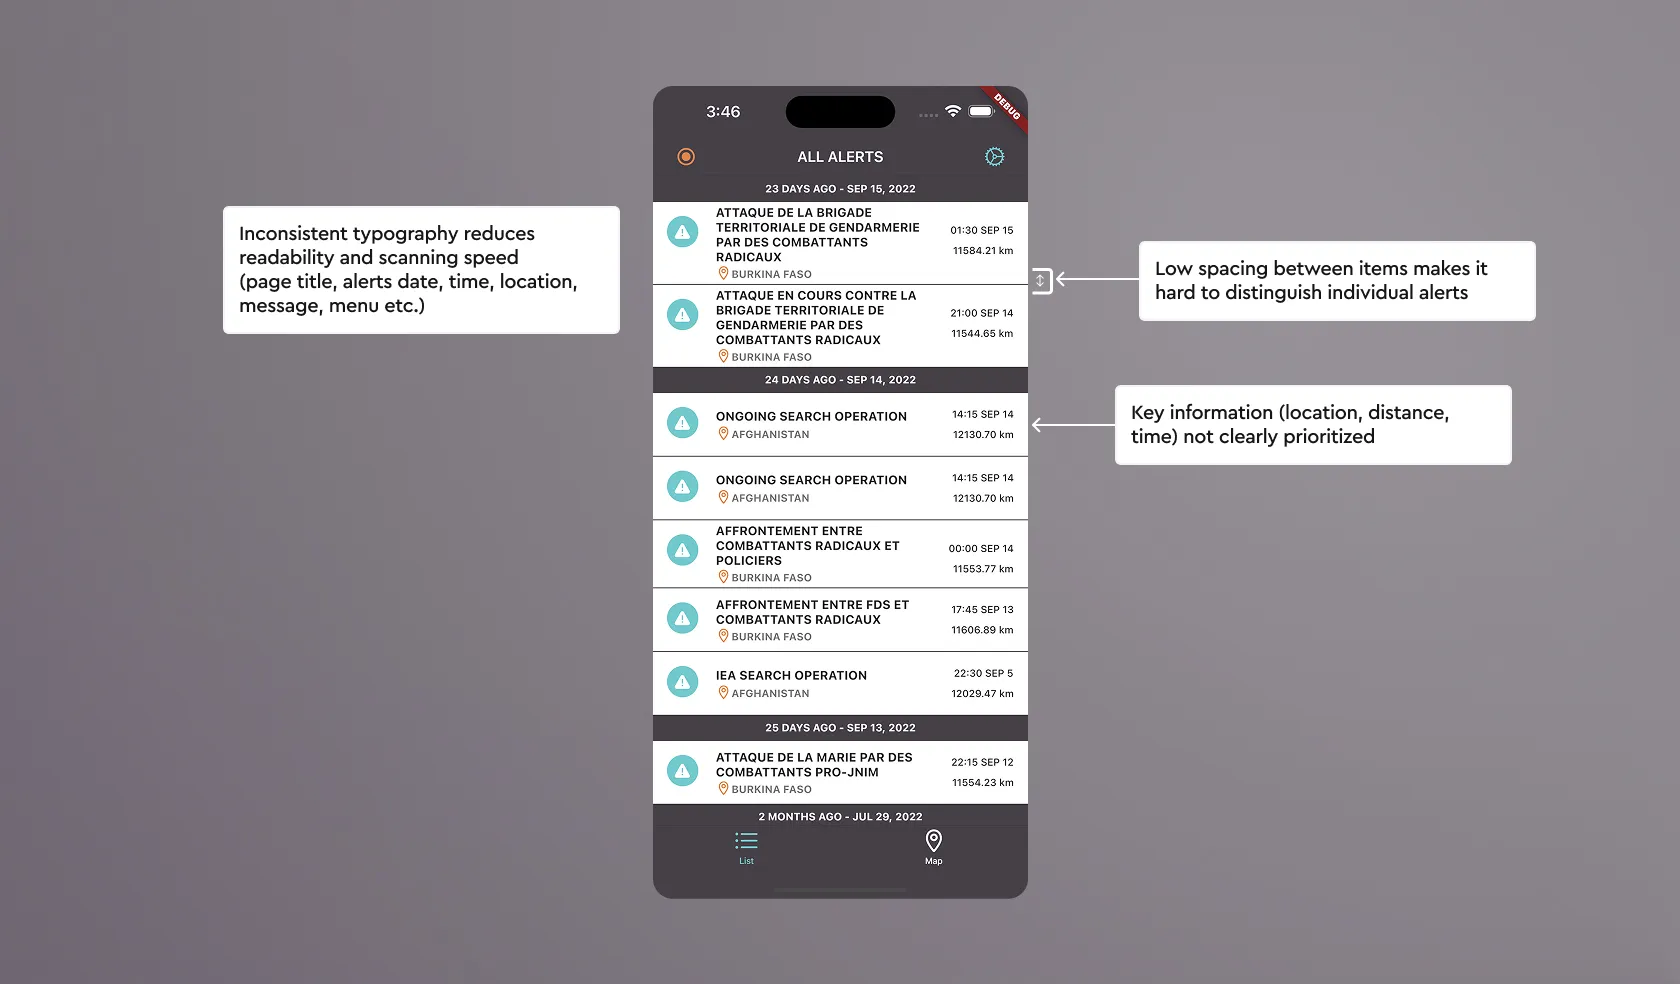
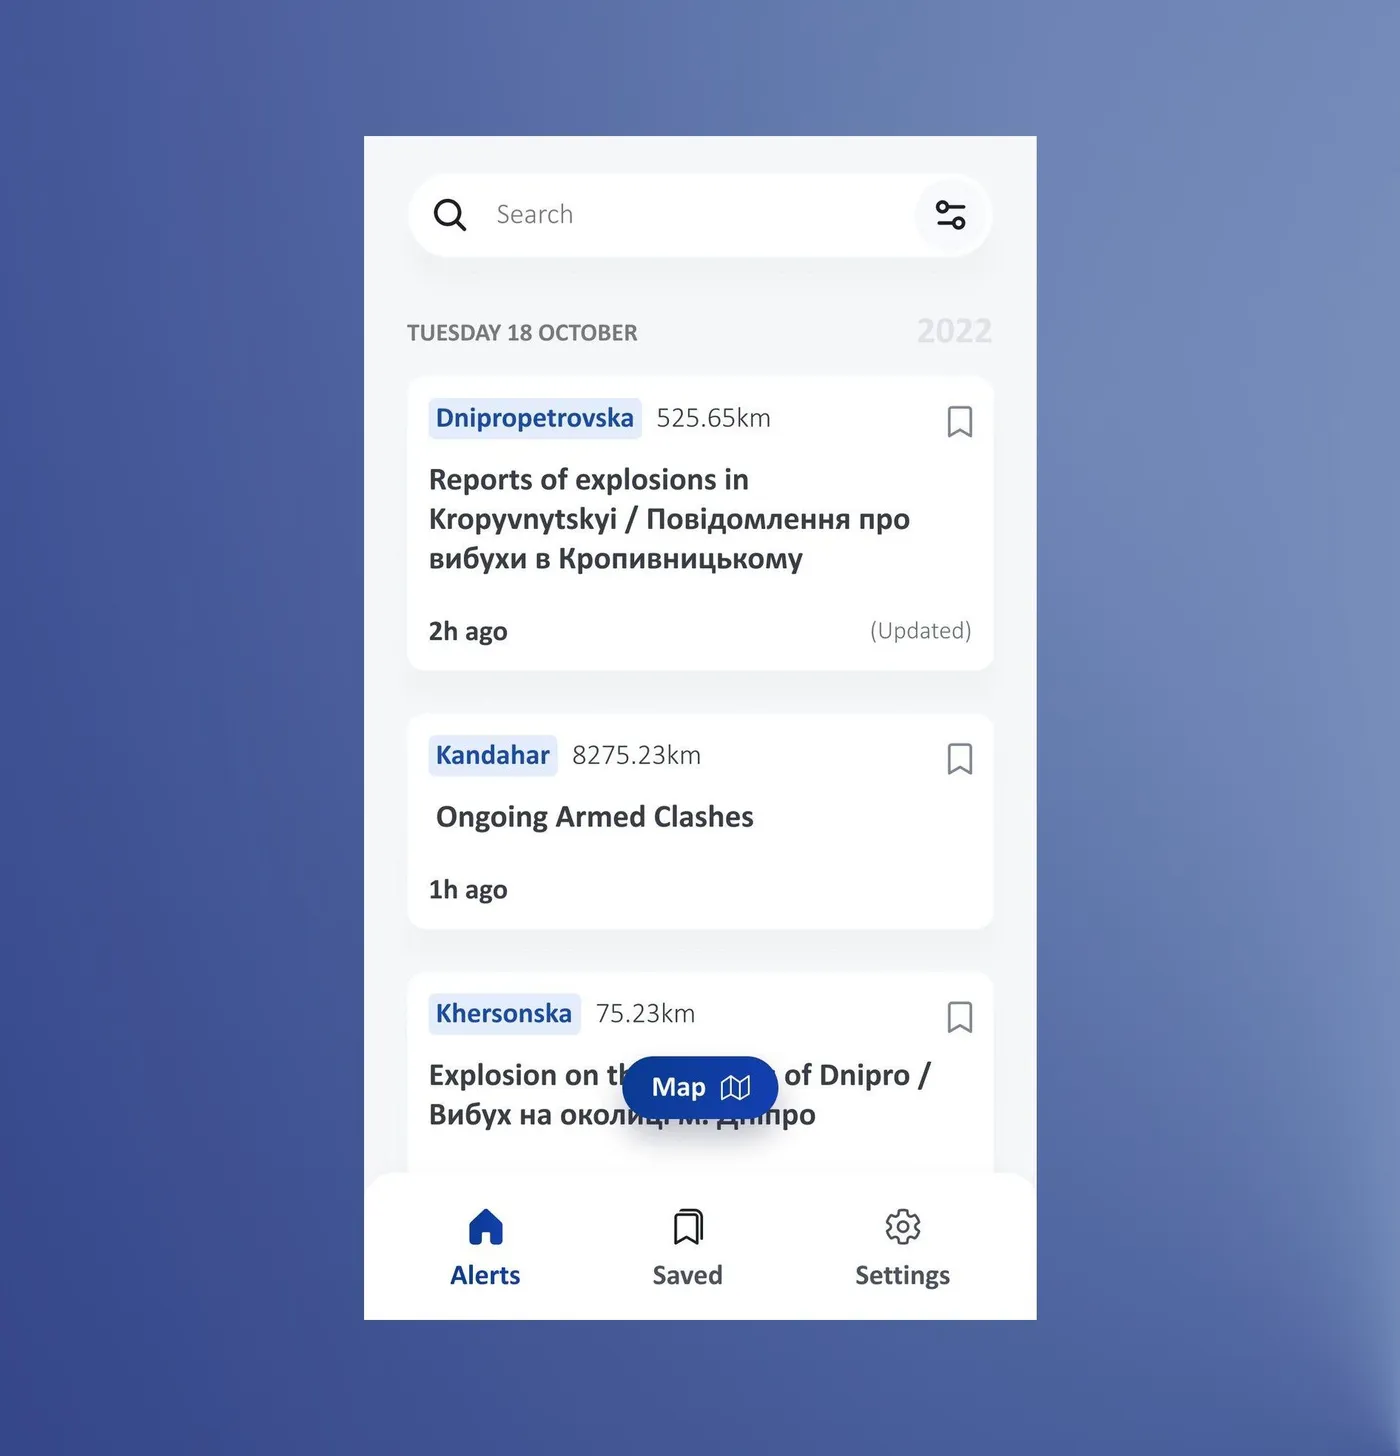
| Alerts list, former design | Redesign approach |
|---|---|
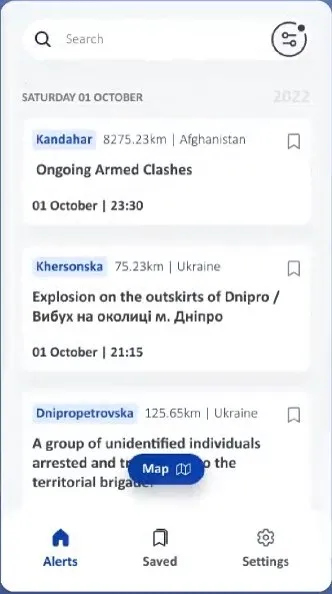
| Five type styles competed in a 70px row: bold all caps titles, small caps locations, all caps dates, tiny right-aligned distance and time | One title style in sentence case, and a clear secondary level for the rest |
| Location, the thing people scan for, was the smallest element, under a four-line title | Location first, then a short title, then time |
| Alerts were separated by a hairline with almost no padding, so rows merged | More space and a clearer boundary between rows |
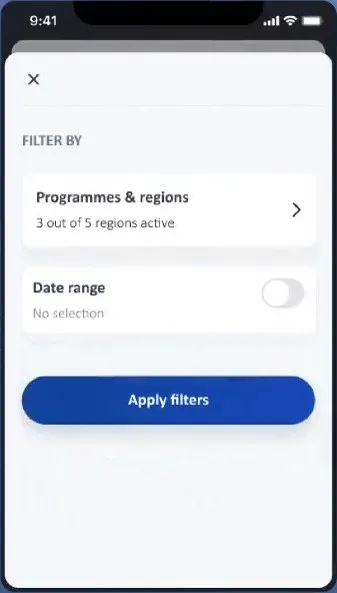
| No search, no filter and no account area, just an unlabelled orange circle and a settings icon | Search at the top, a simpler filter, and an entry for the profile, terms and help |
| Every alert had the same warning icon, with no cue for new or unseen alerts and no way to save | A marker for unseen alerts, a Recent Alerts block, and a save button on each alert |
Hide tableShow table
Saved alerts weren't in the first draft. I asked the country office colleagues, who stood in for partners, how people could keep track of the alerts they care about when they all mix together, and we landed on pinning them. It started as one Saved page in the bottom menu, next to Alerts and Settings.
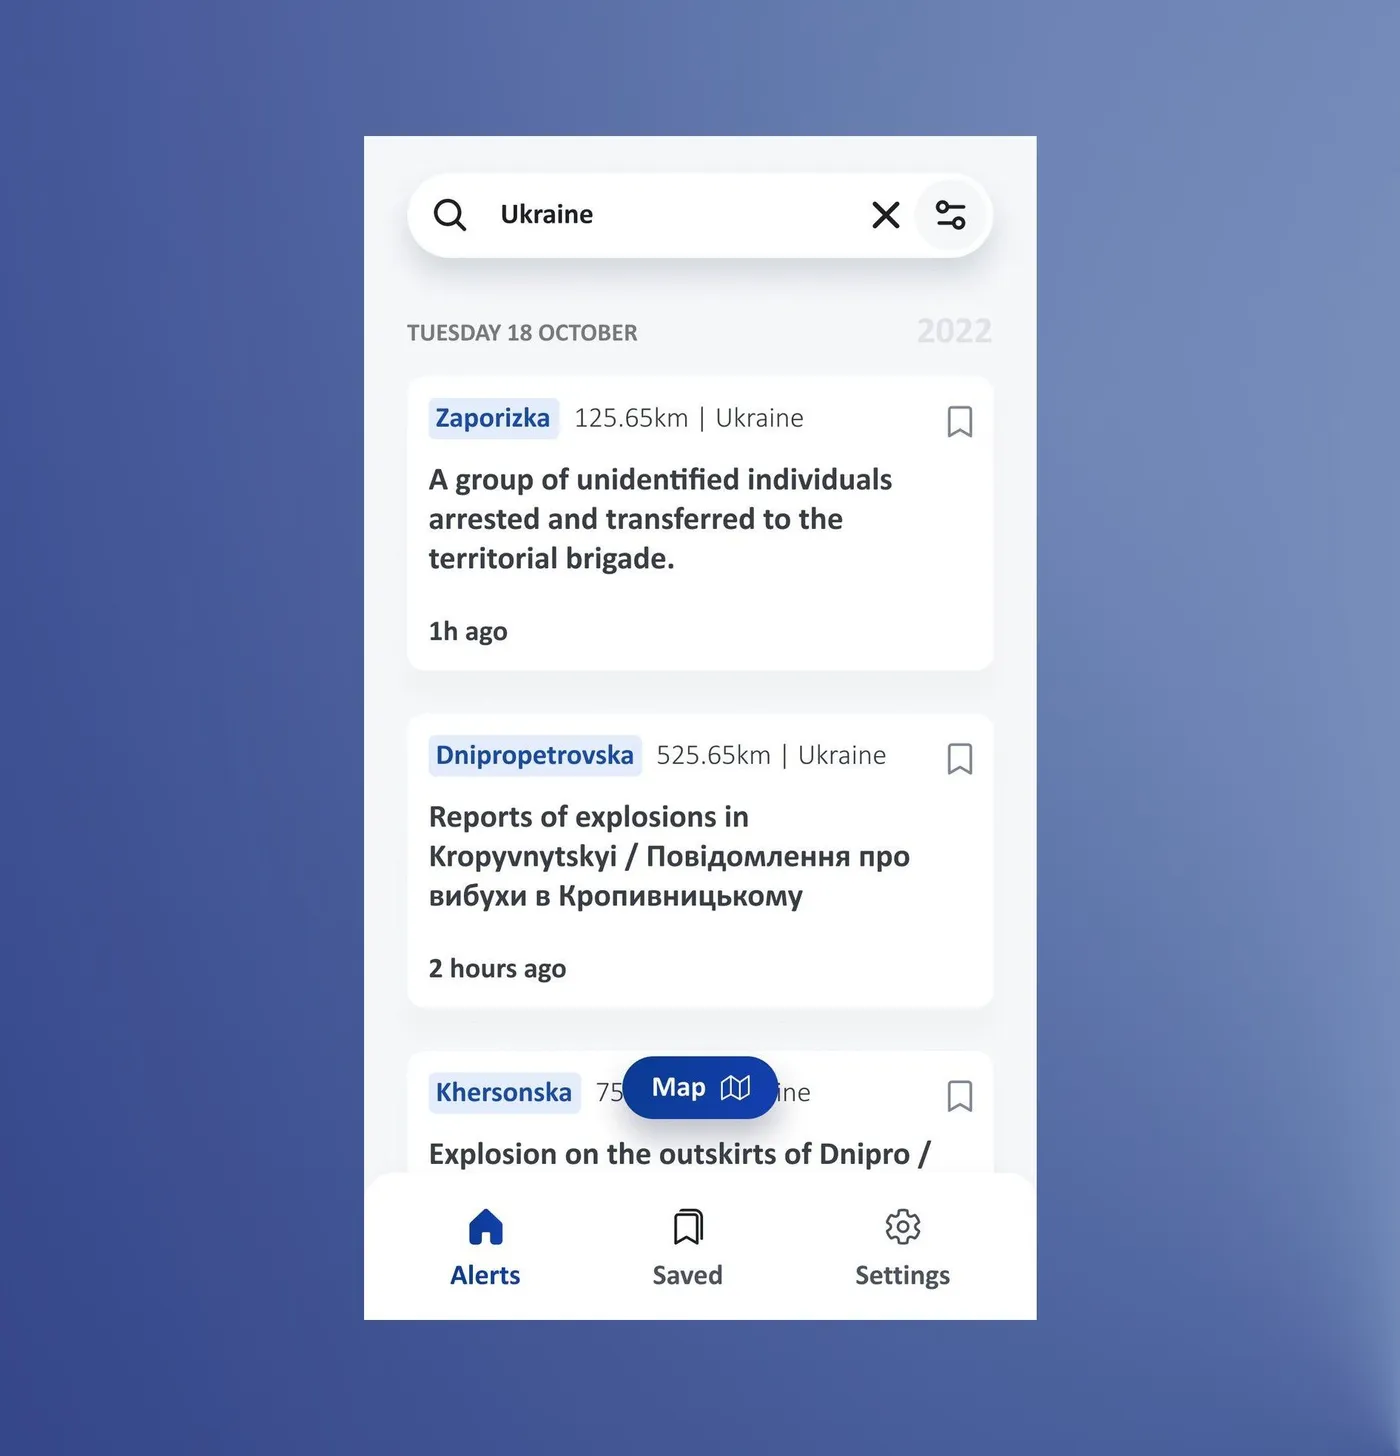
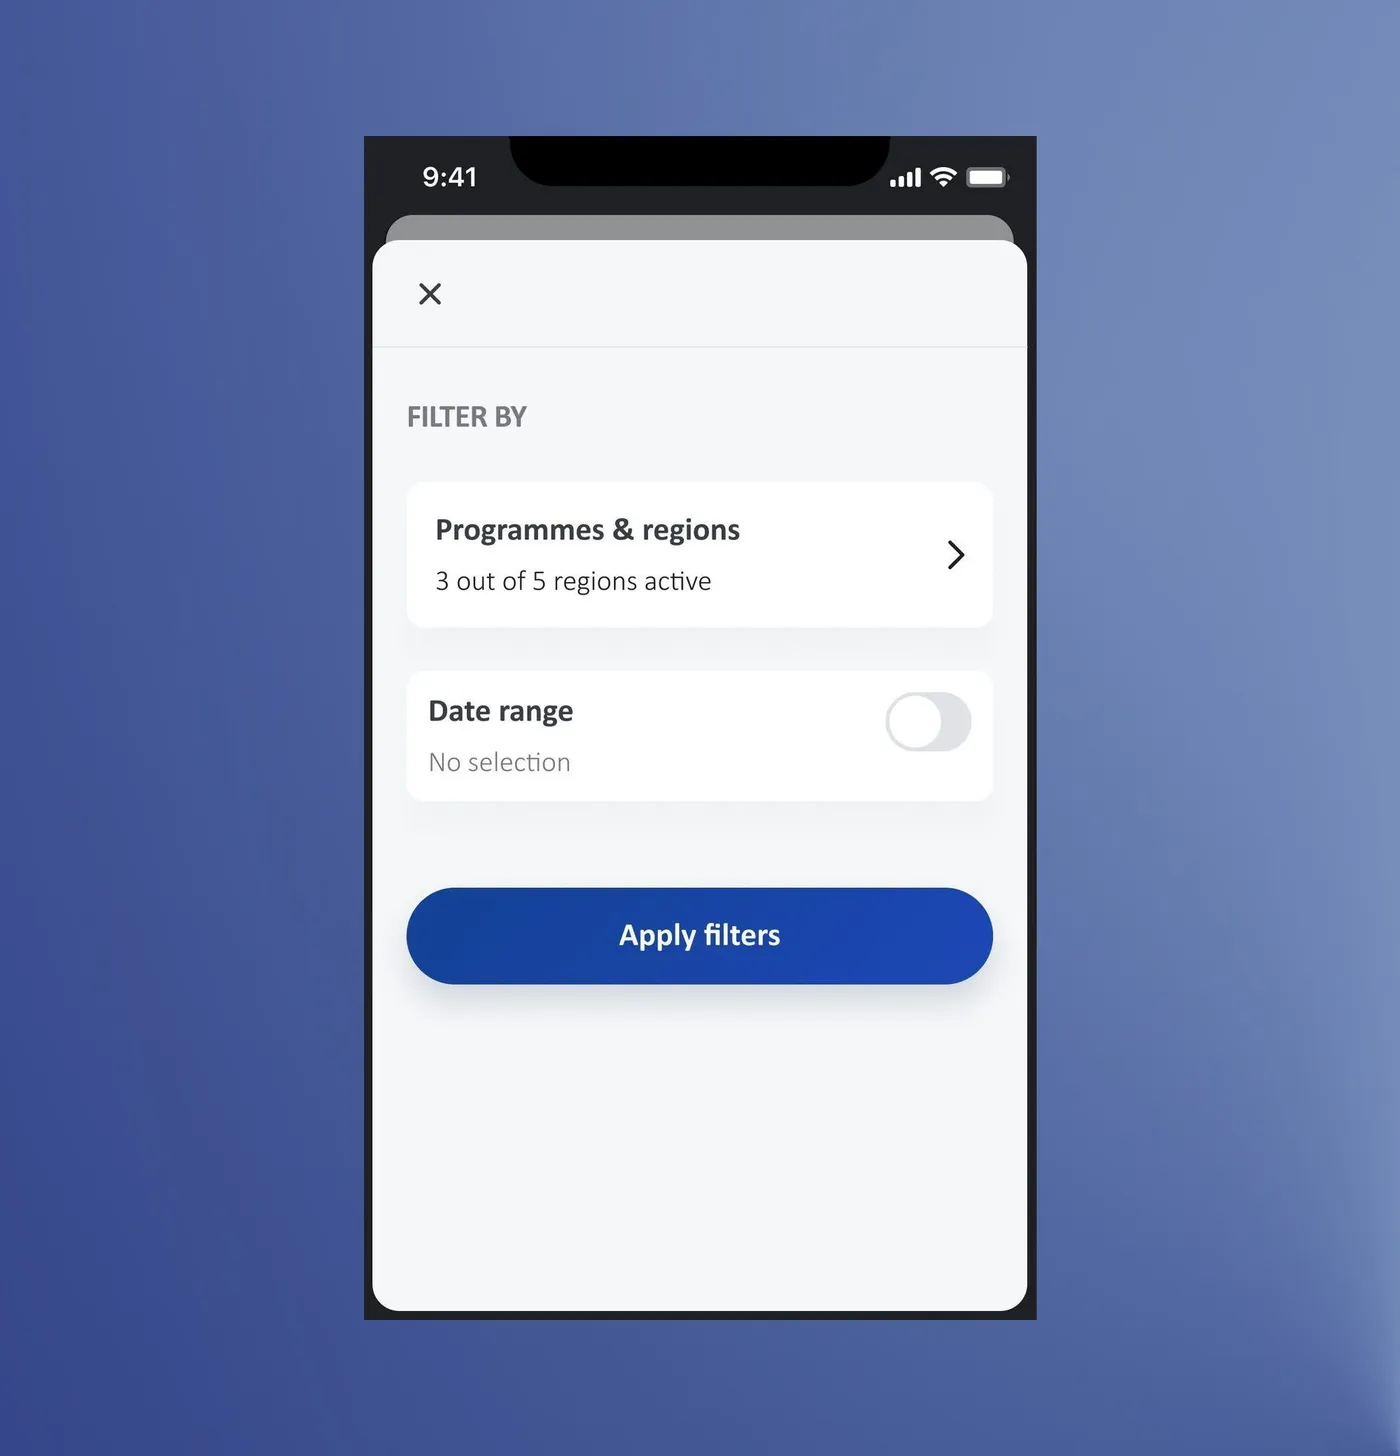
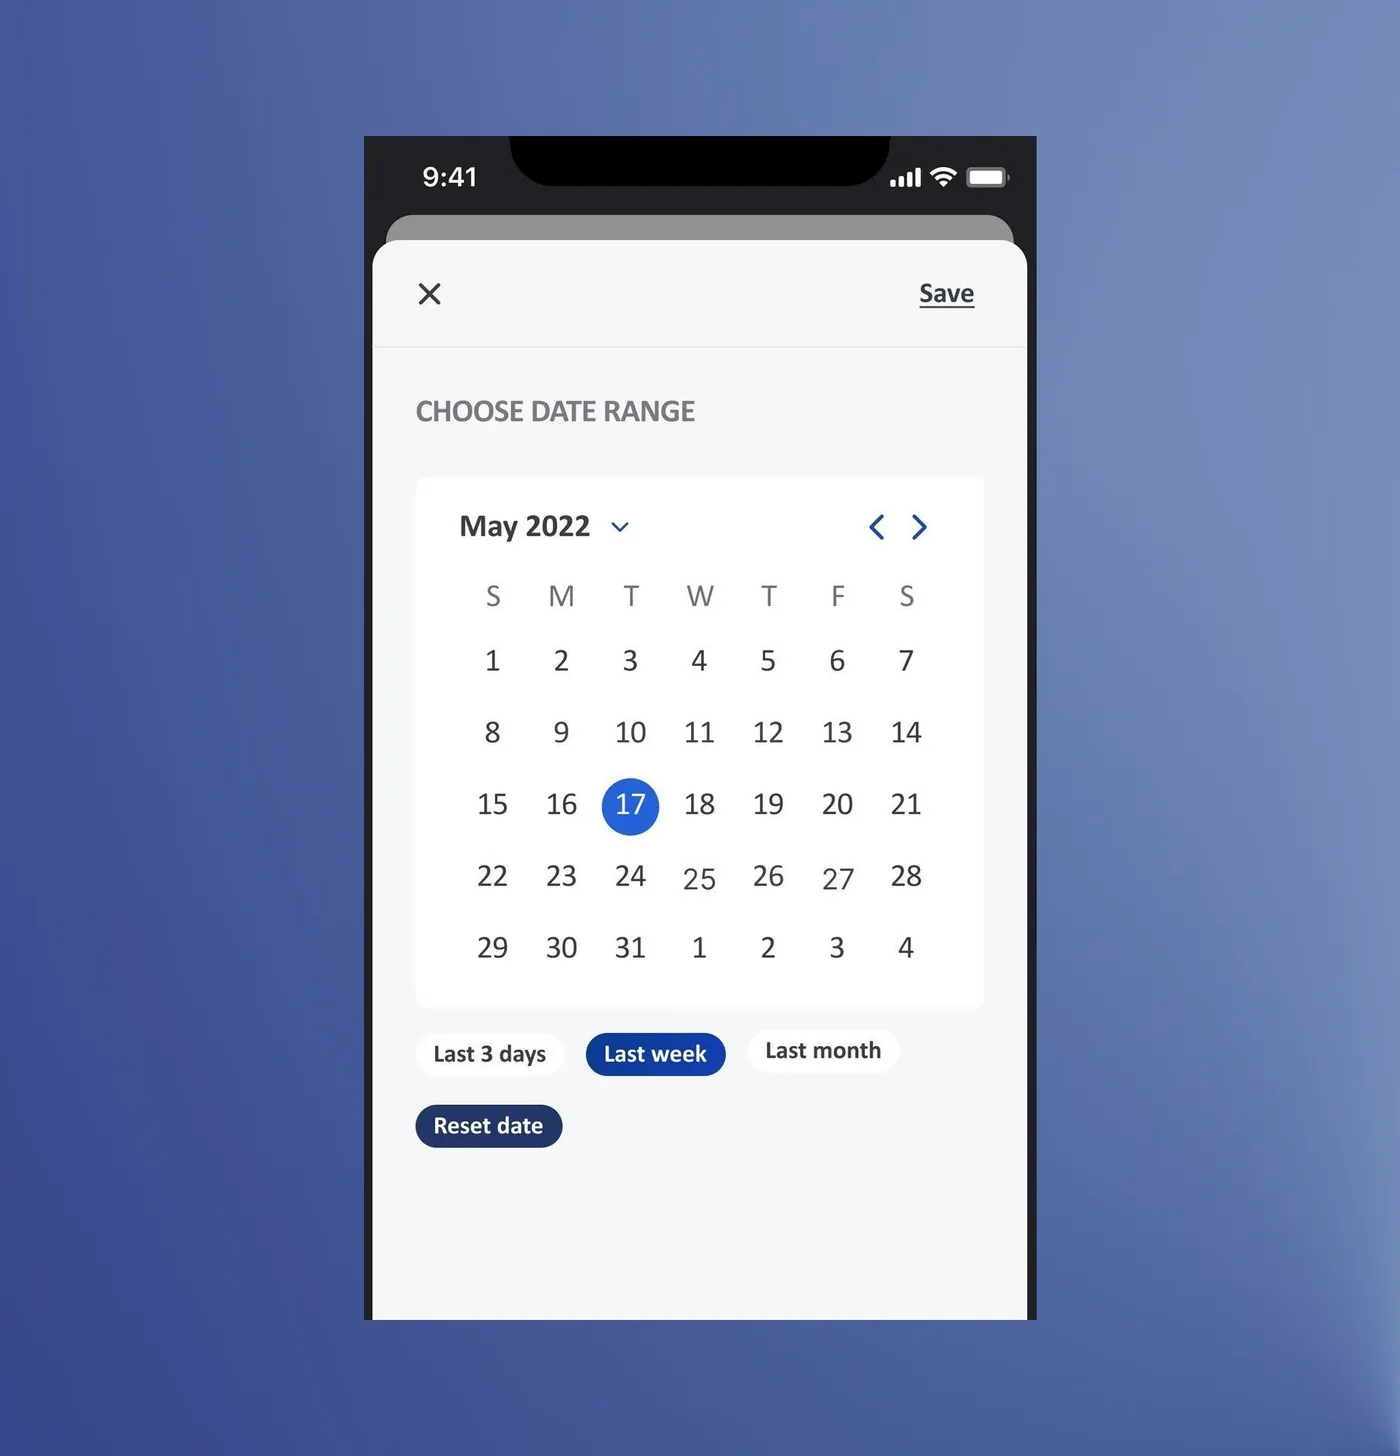
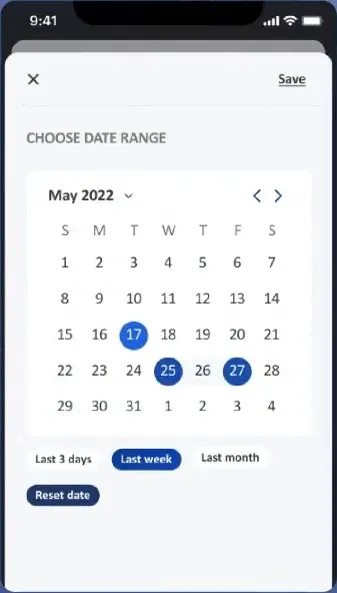
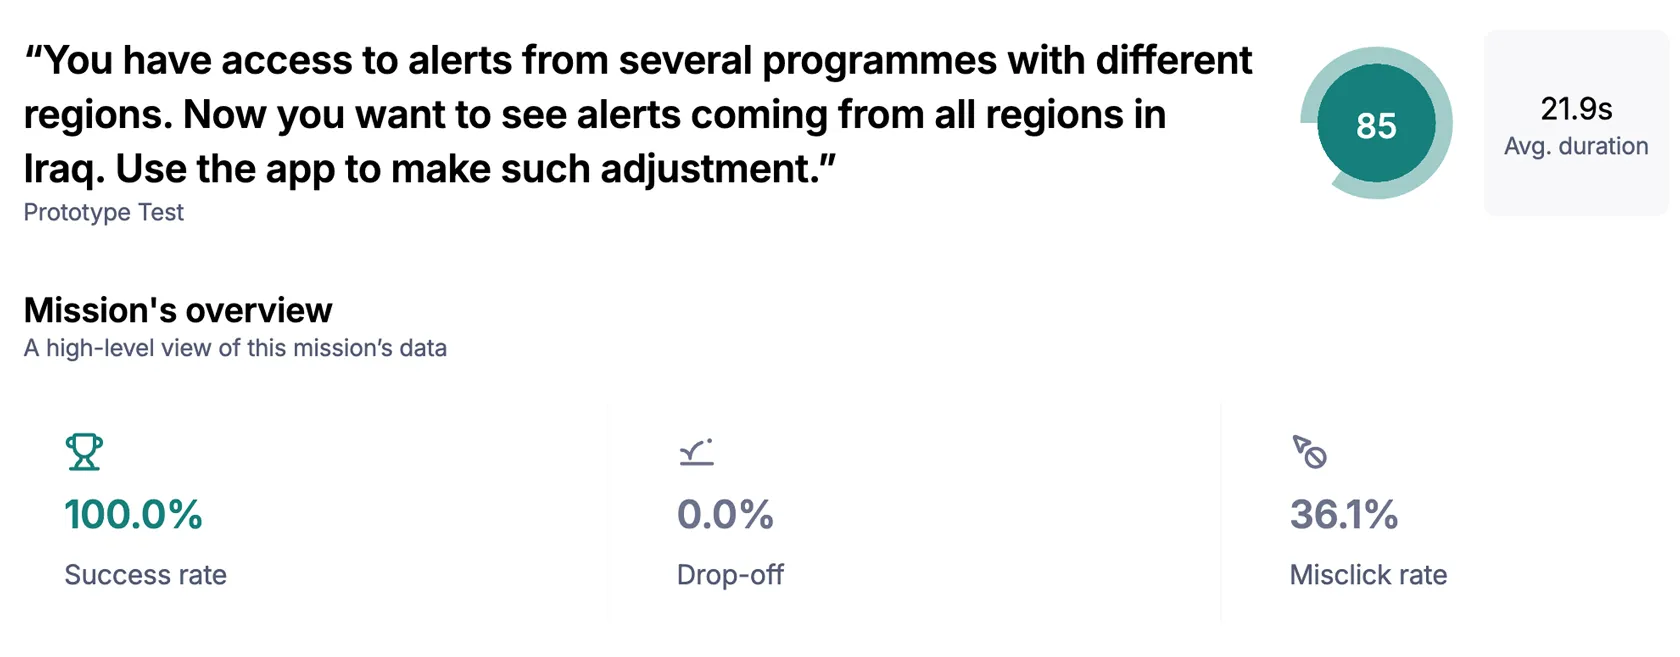
Filtering was quick and easy: testers found alerts by place or by date in about 20 seconds.
10 of 10 filtered by location in 22 s on average, ease 9.3/10 · 13 filtered by date in 19 s, ease 8.2/10 · Maze tests with country office colleagues
Alert detail
I am in an alert. What information will help me the most?
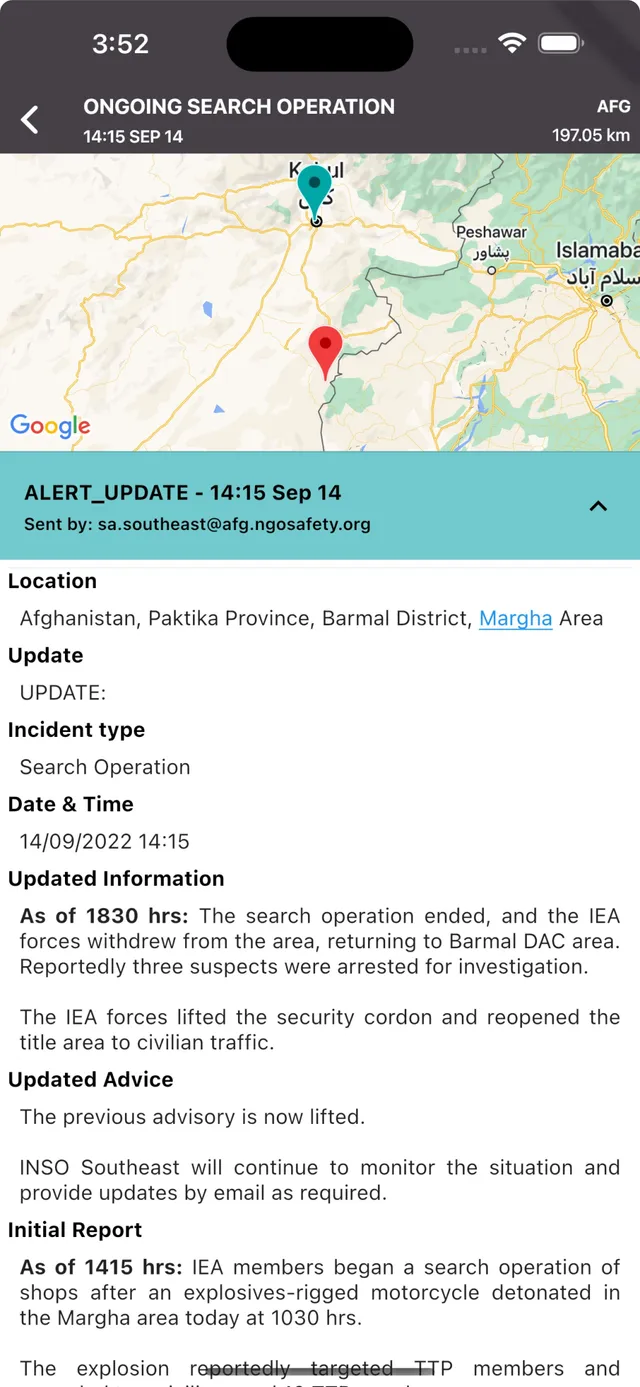
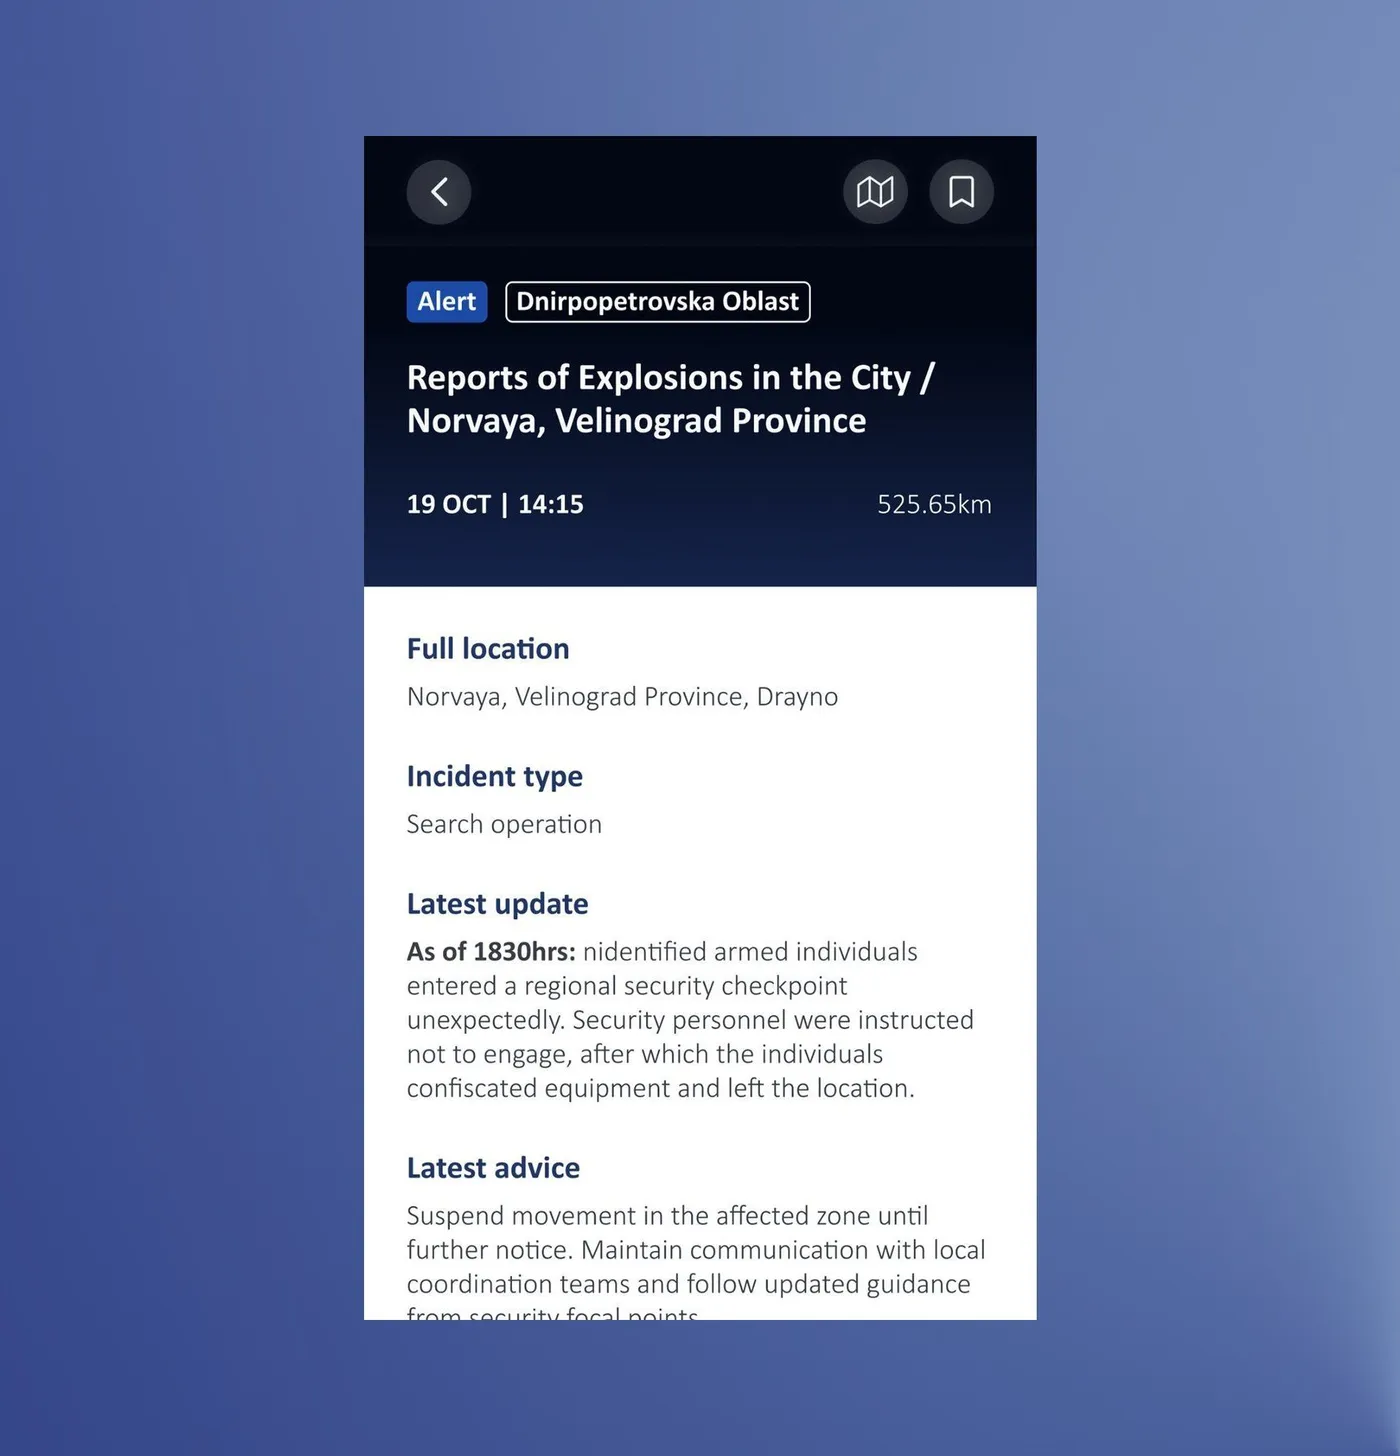
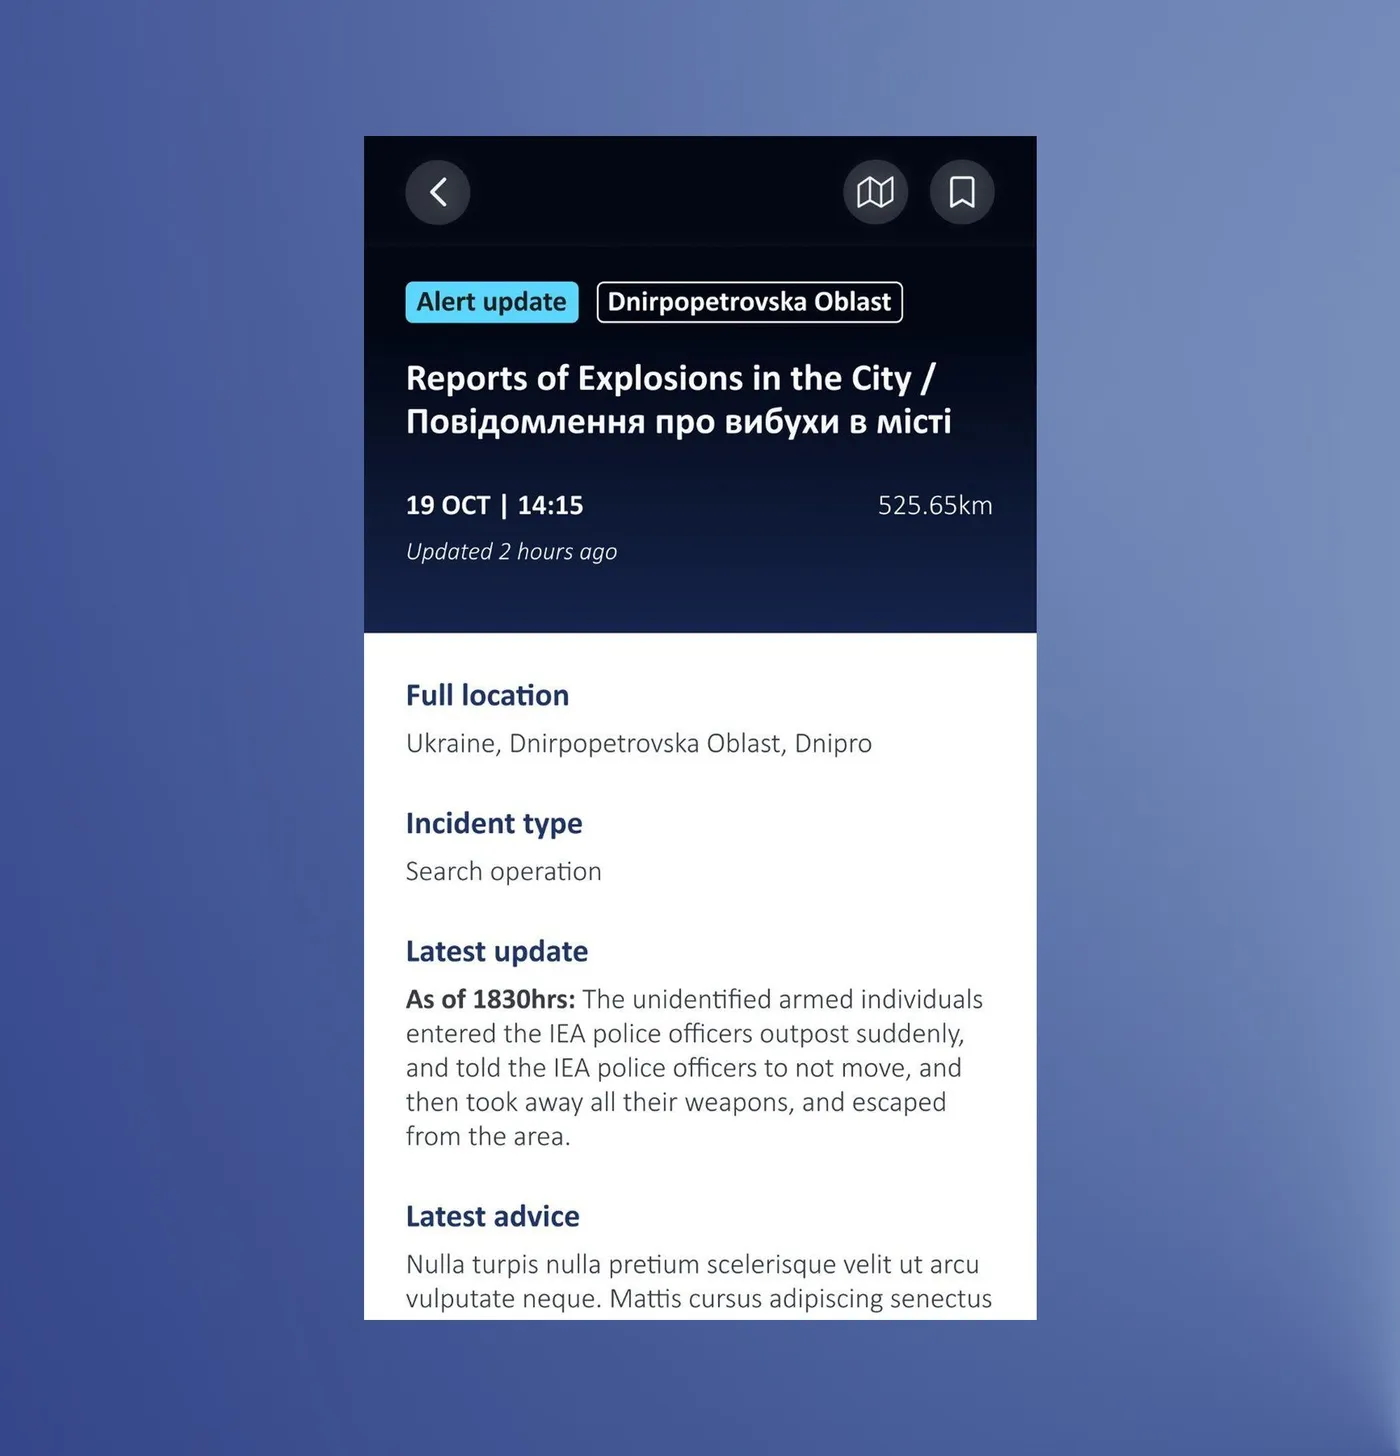
| Alert detail, former design | Redesign approach |
|---|---|
| The map filled the top third, so the facts came after it | A summary first (what, where, when, how far), with the map moved lower |
| Two pins, teal and red, with no legend | One pin, with the place name and distance below |
| The latest update and advice were buried under five lower-value fields | Full location, incident type, latest update, latest advice, in the order the interviews showed |
| The date and time showed three times in three formats, and one field was empty | One date and time, and the empty field is gone |
| A raw system label (ALERT_UPDATE) and an email address served as the banner | A clear "Alert update" tag, and an "Alerts history" section |
| Body text was justified with uneven margins, and headings looked like body text | Left-aligned text with consistent margins, and clear headings with space around them |
Hide tableShow table
Maps
A map adds the where, for people who need it
Most people never open the map. By default the app does what SMS and email did: it sends you the alerts from the regions you subscribed to, and that is the main use. On top of that it adds a map layer and more control, like choosing the areas you want alerts from and the map mode that fits what you're doing. The map is for people who need to see where an alert comes from, follow one area, or explore during a mission, and who would otherwise need another map tool. About 1 in 6 people who used the app have opened a map.
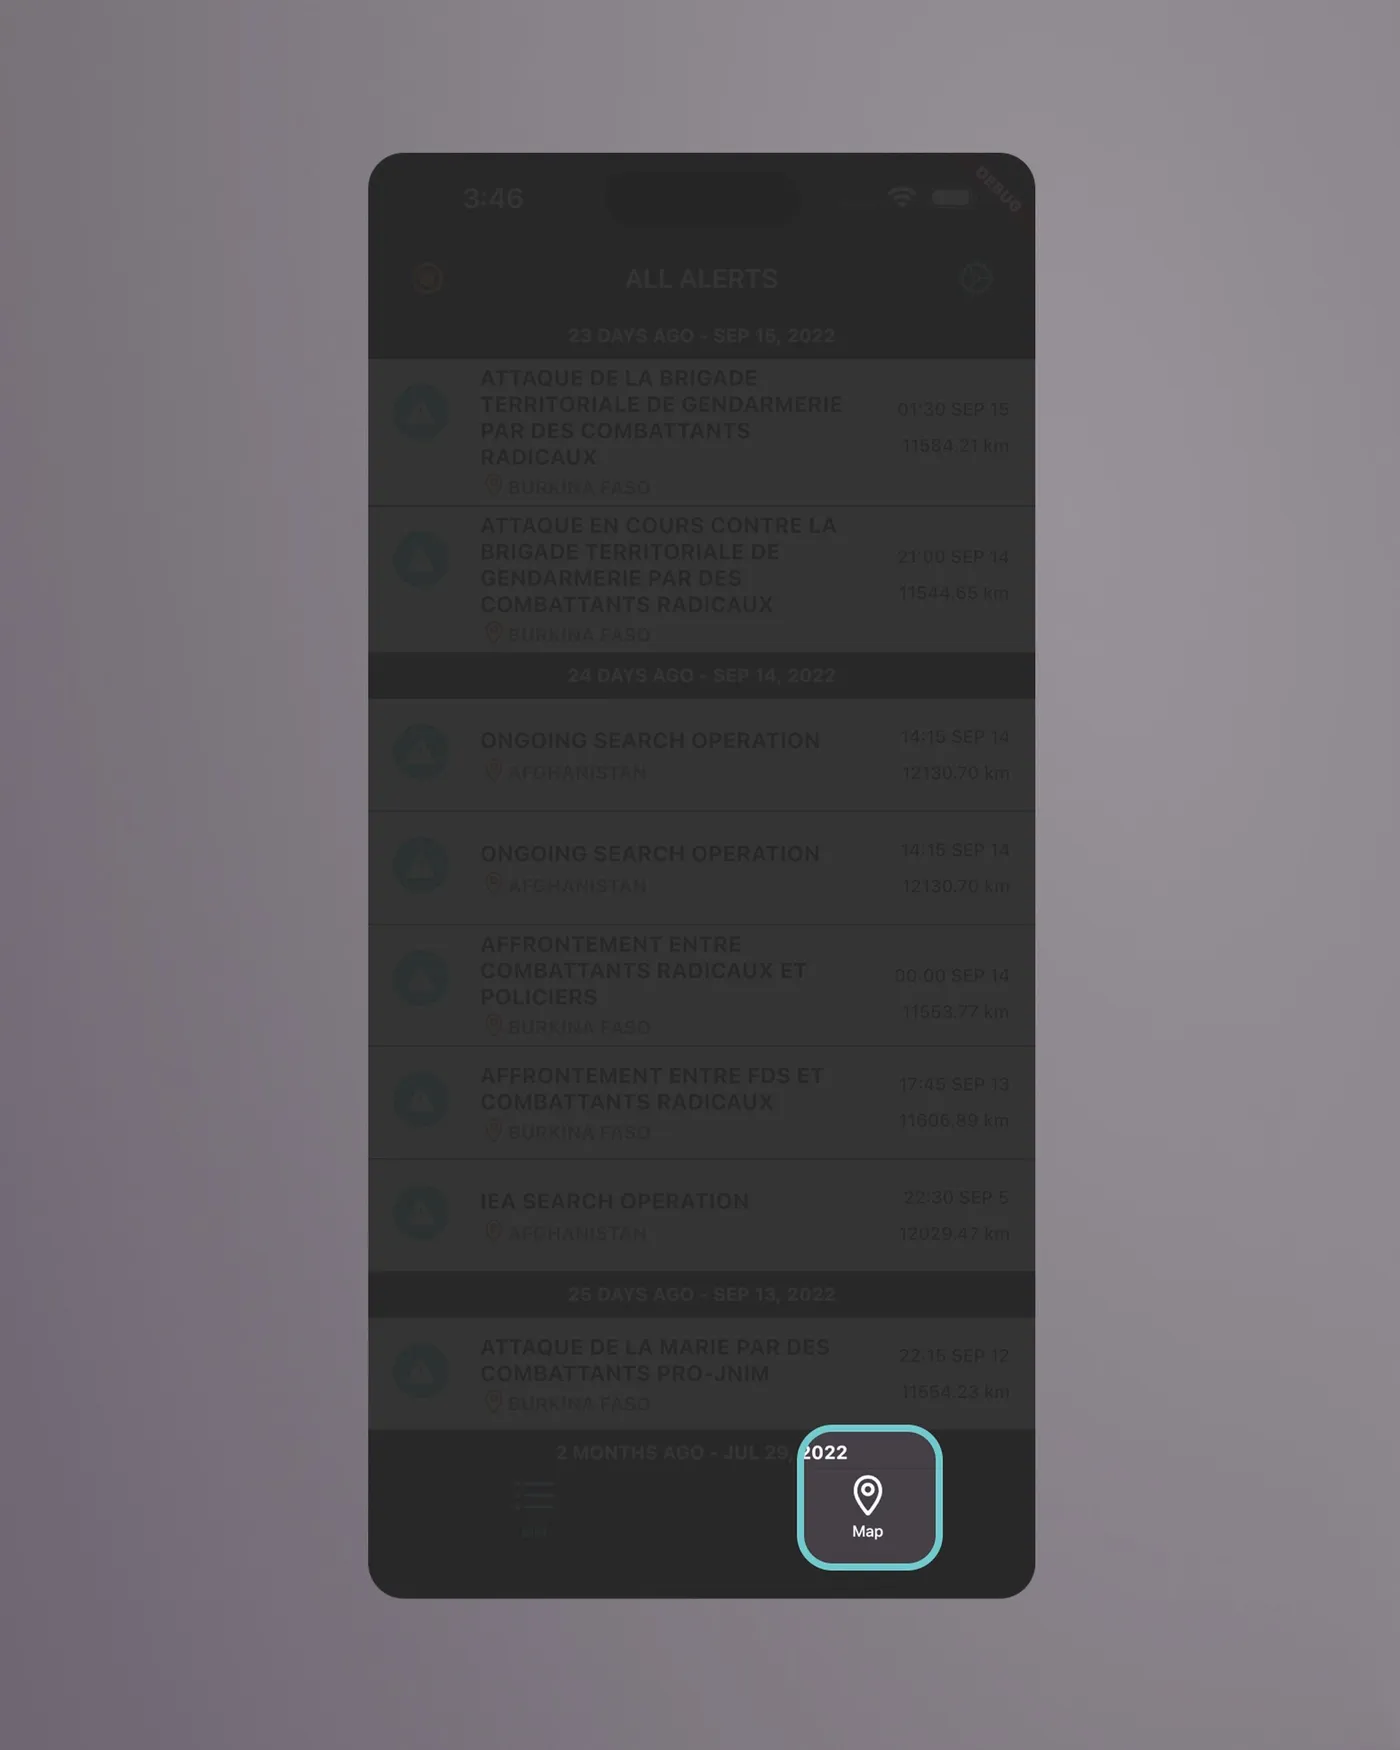
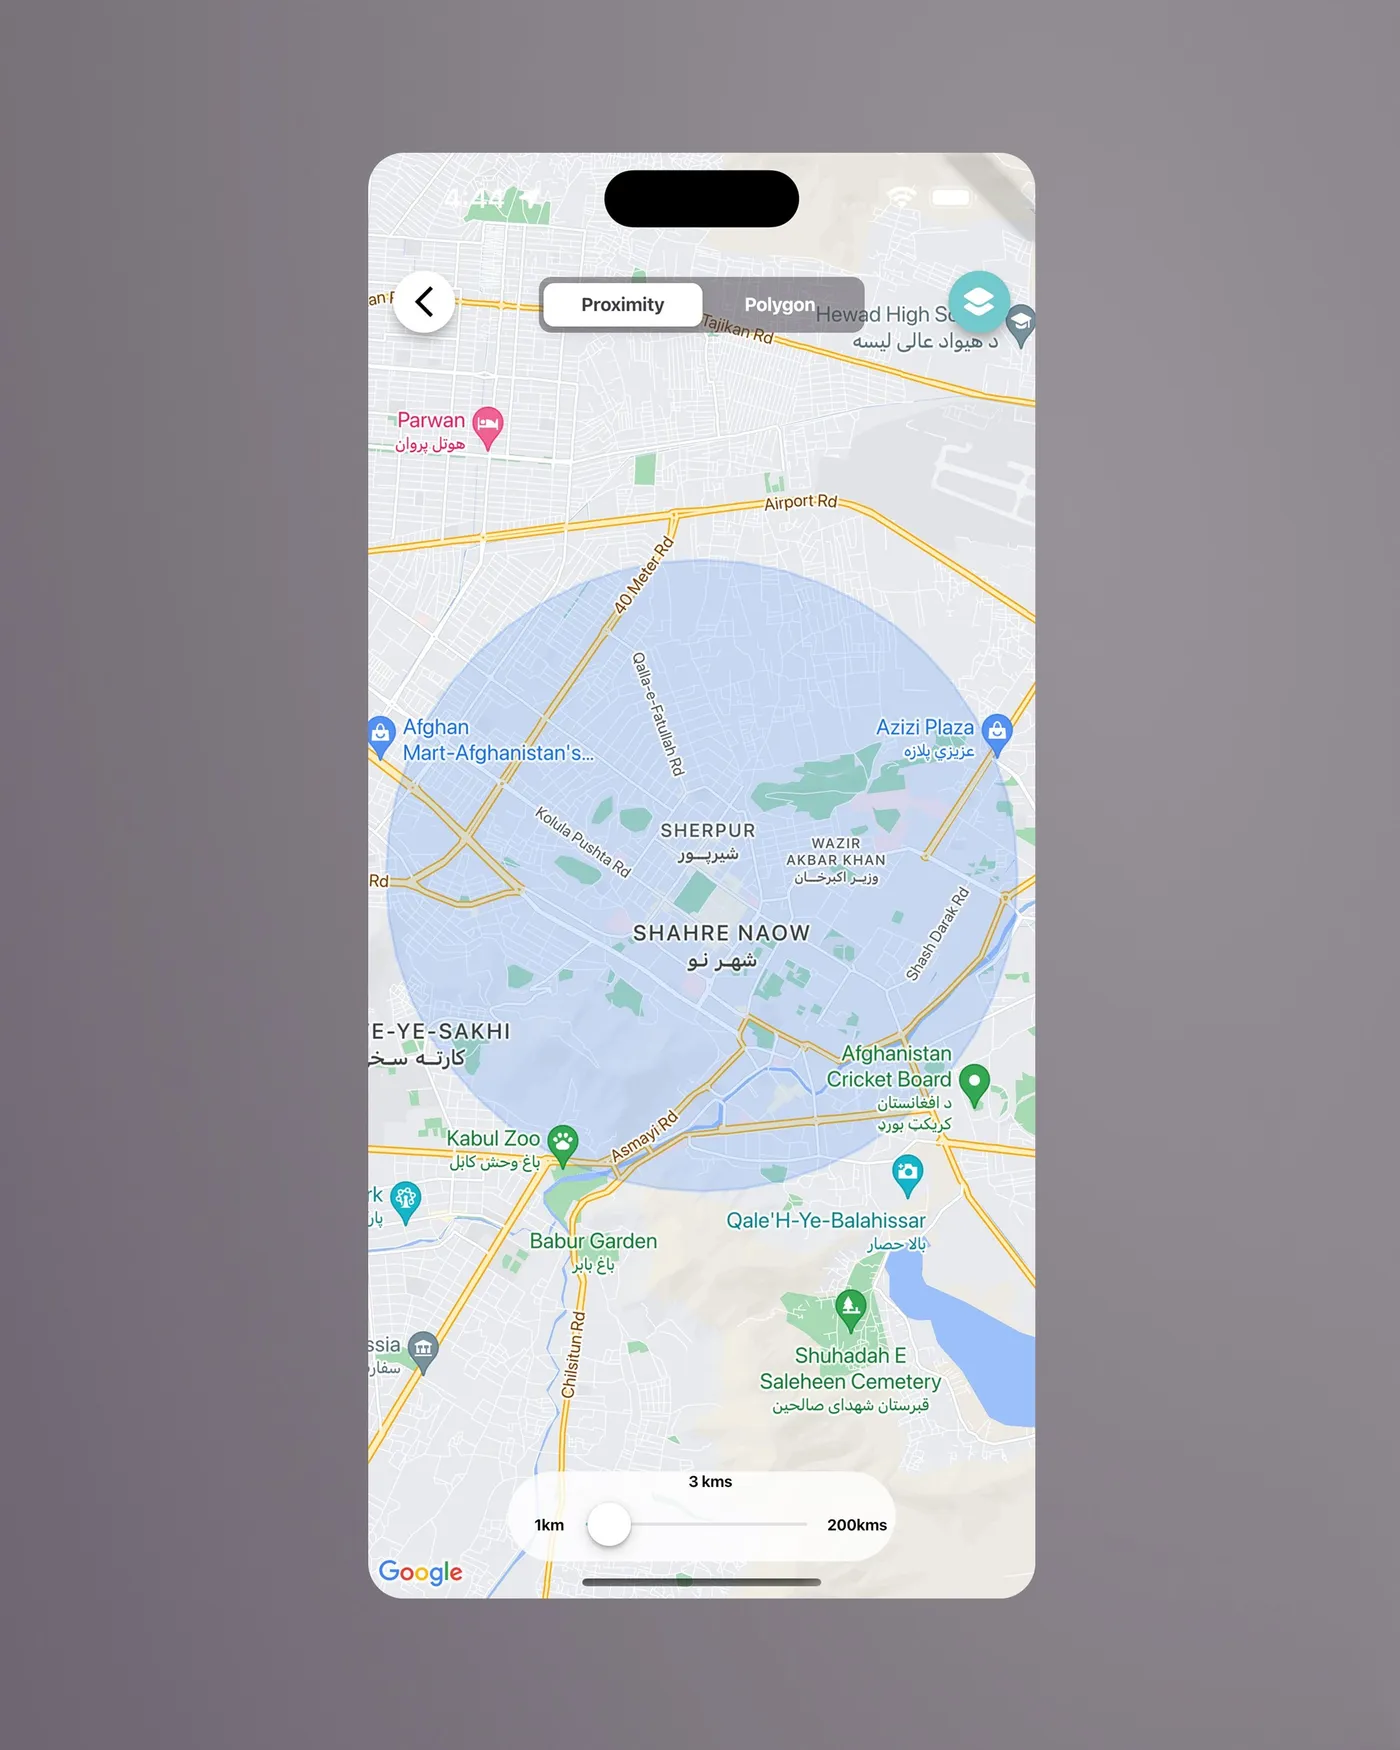
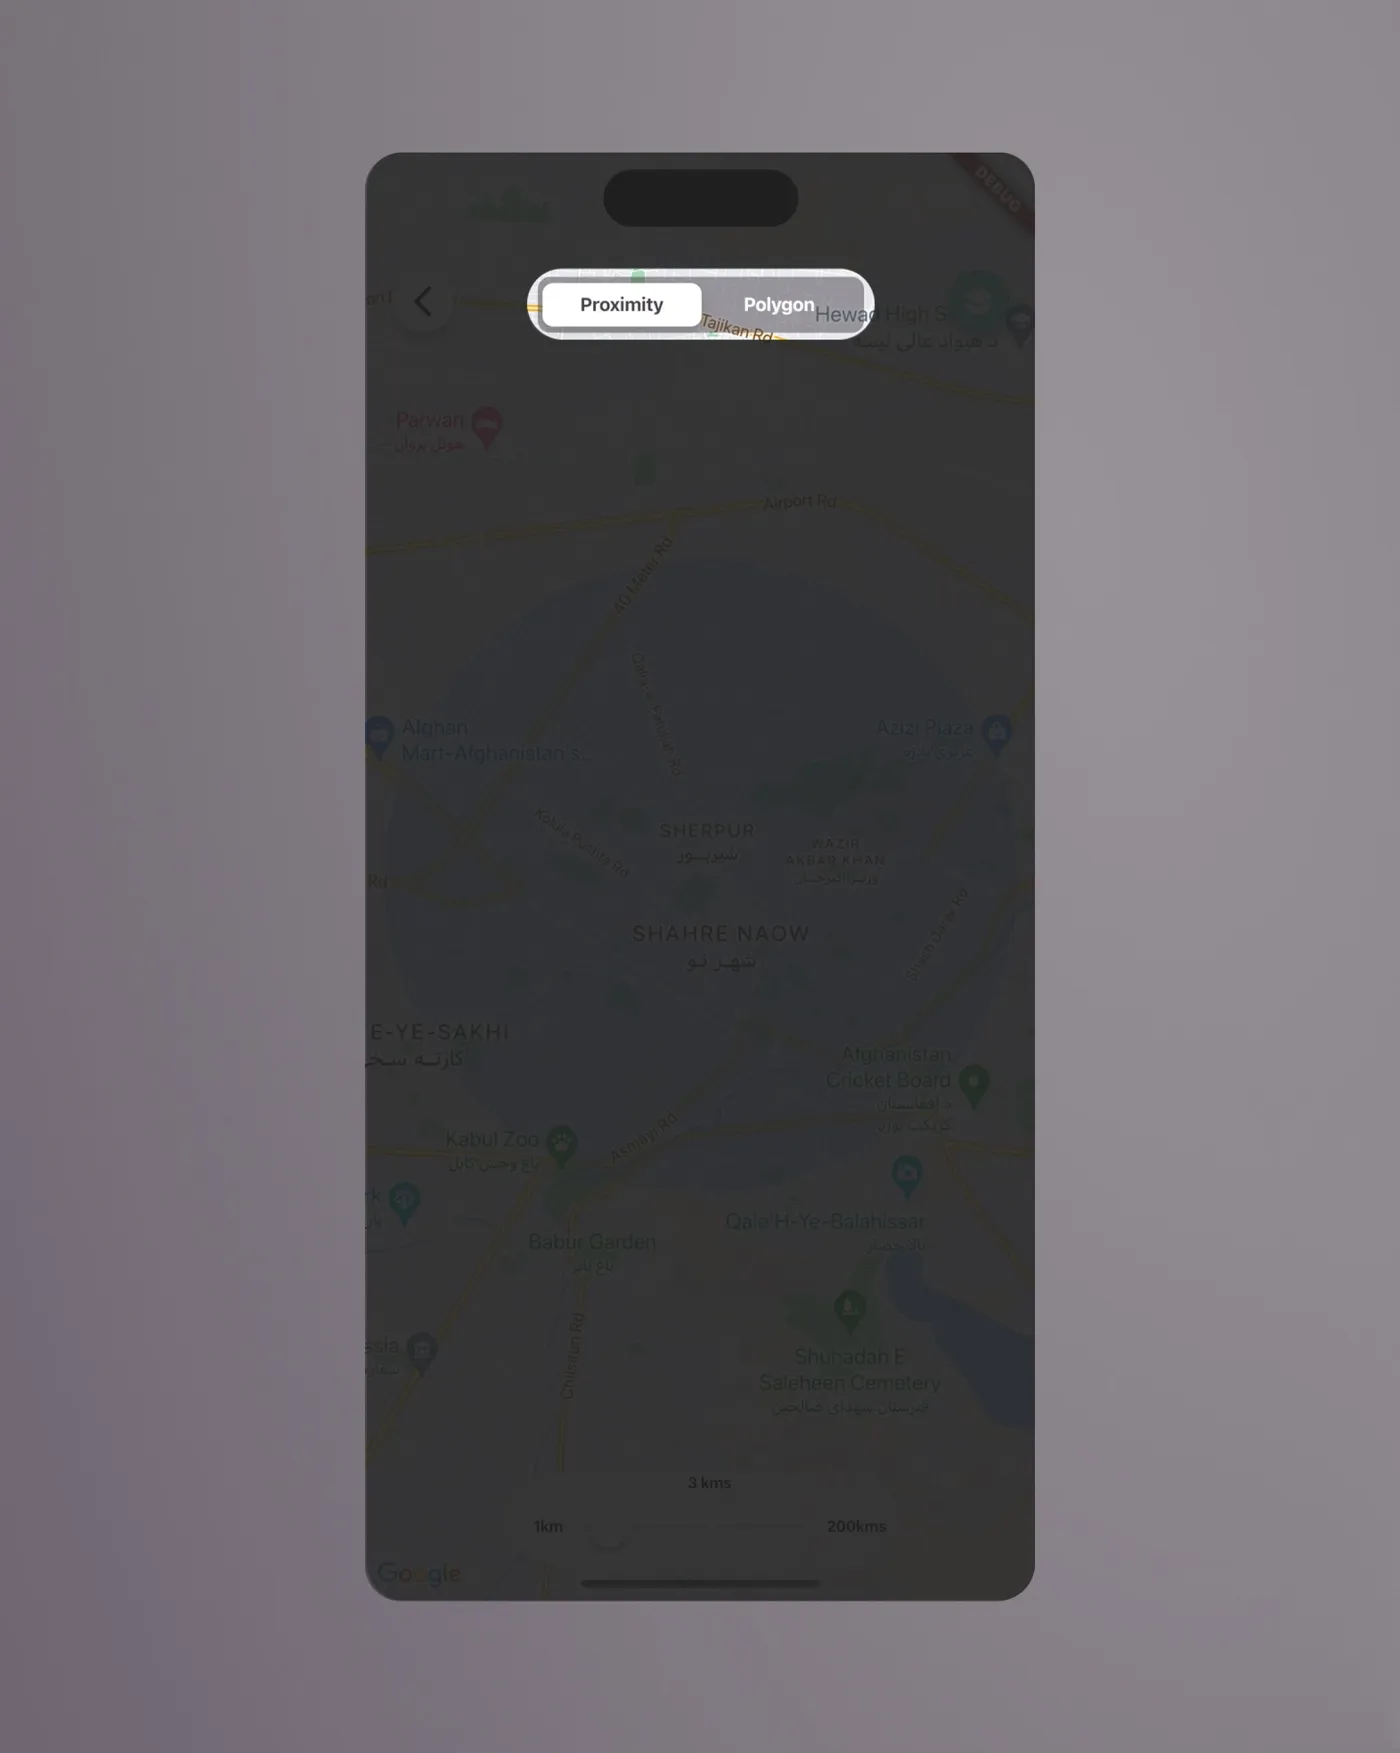
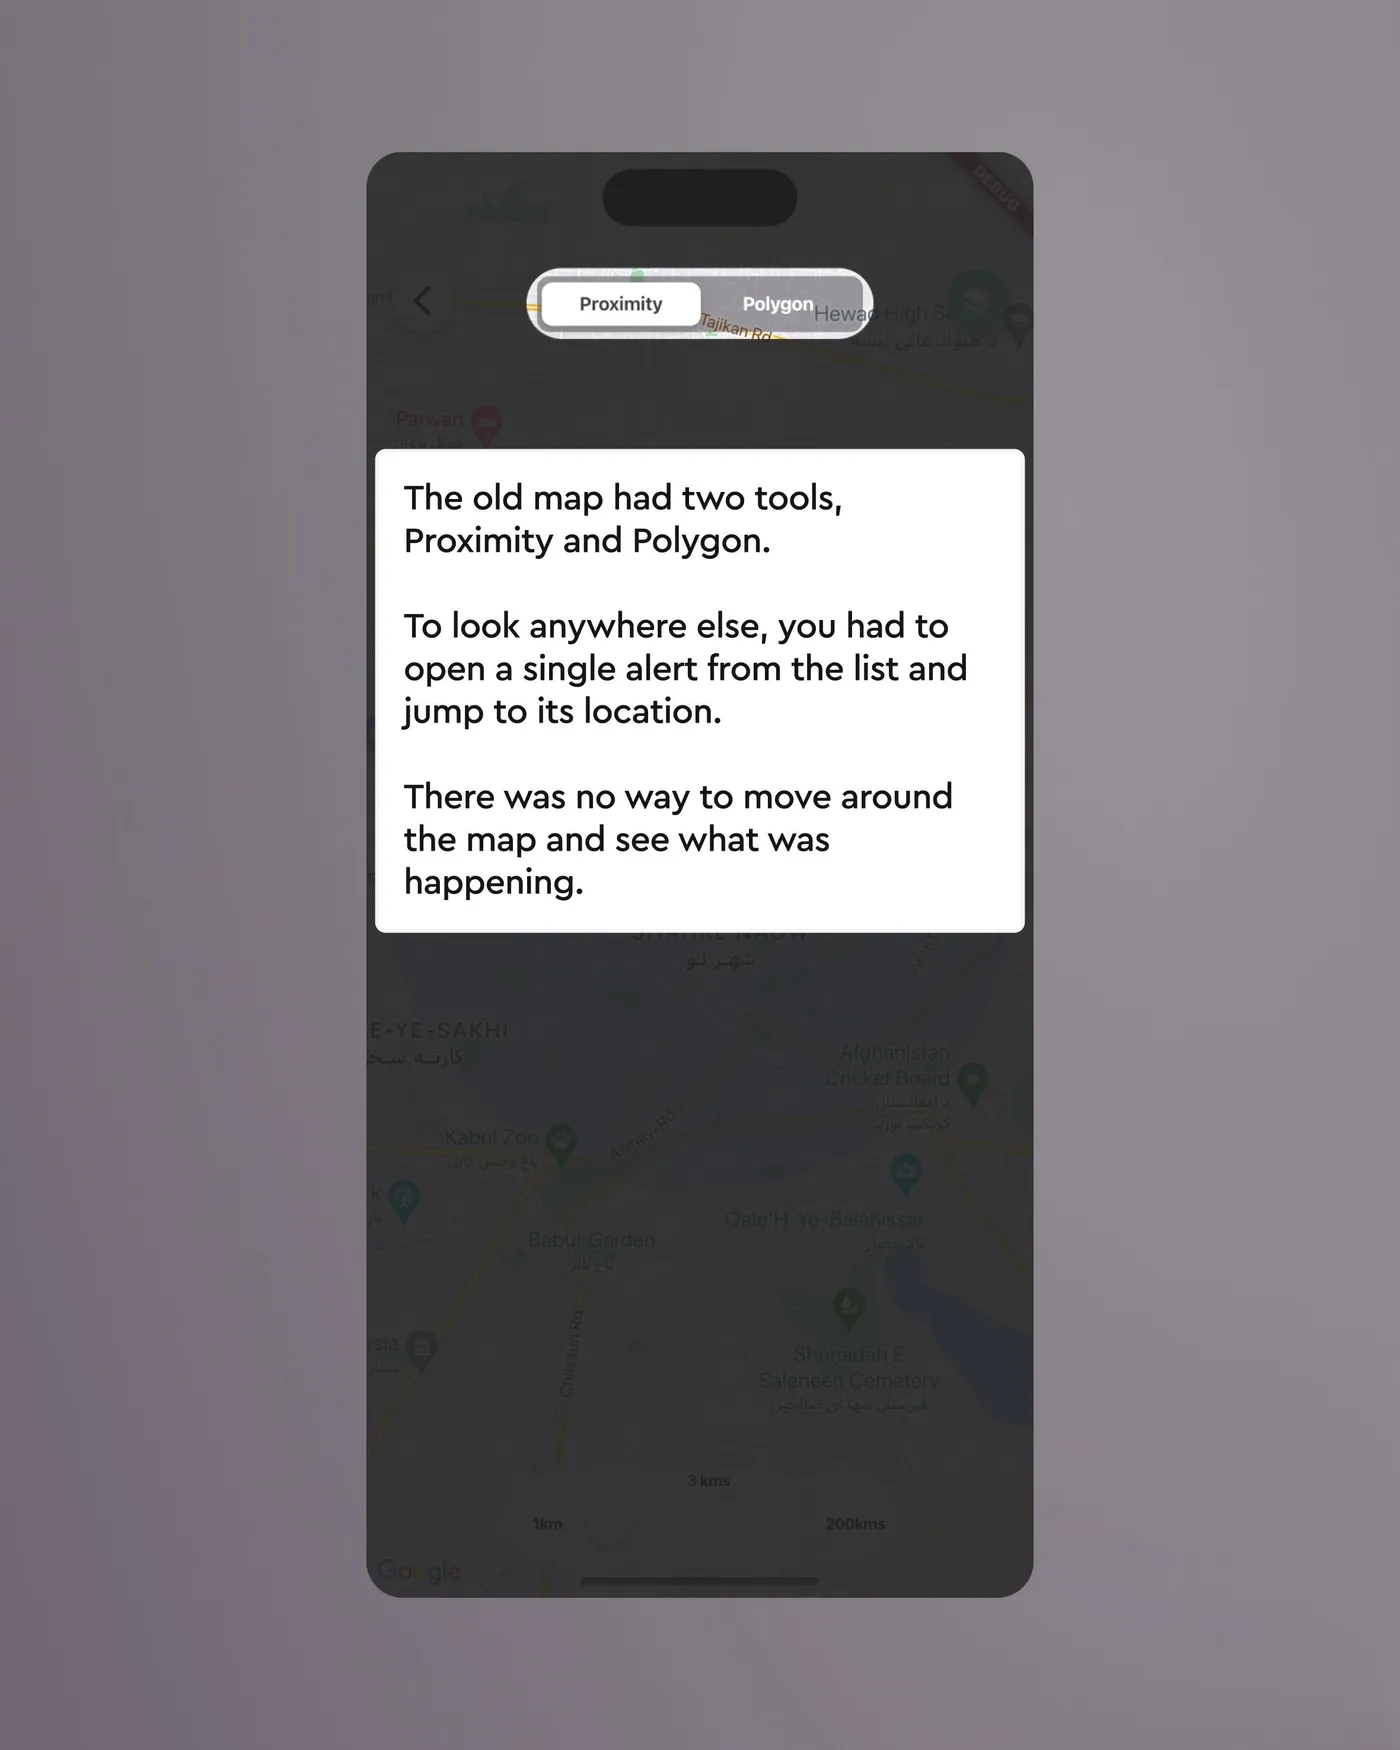
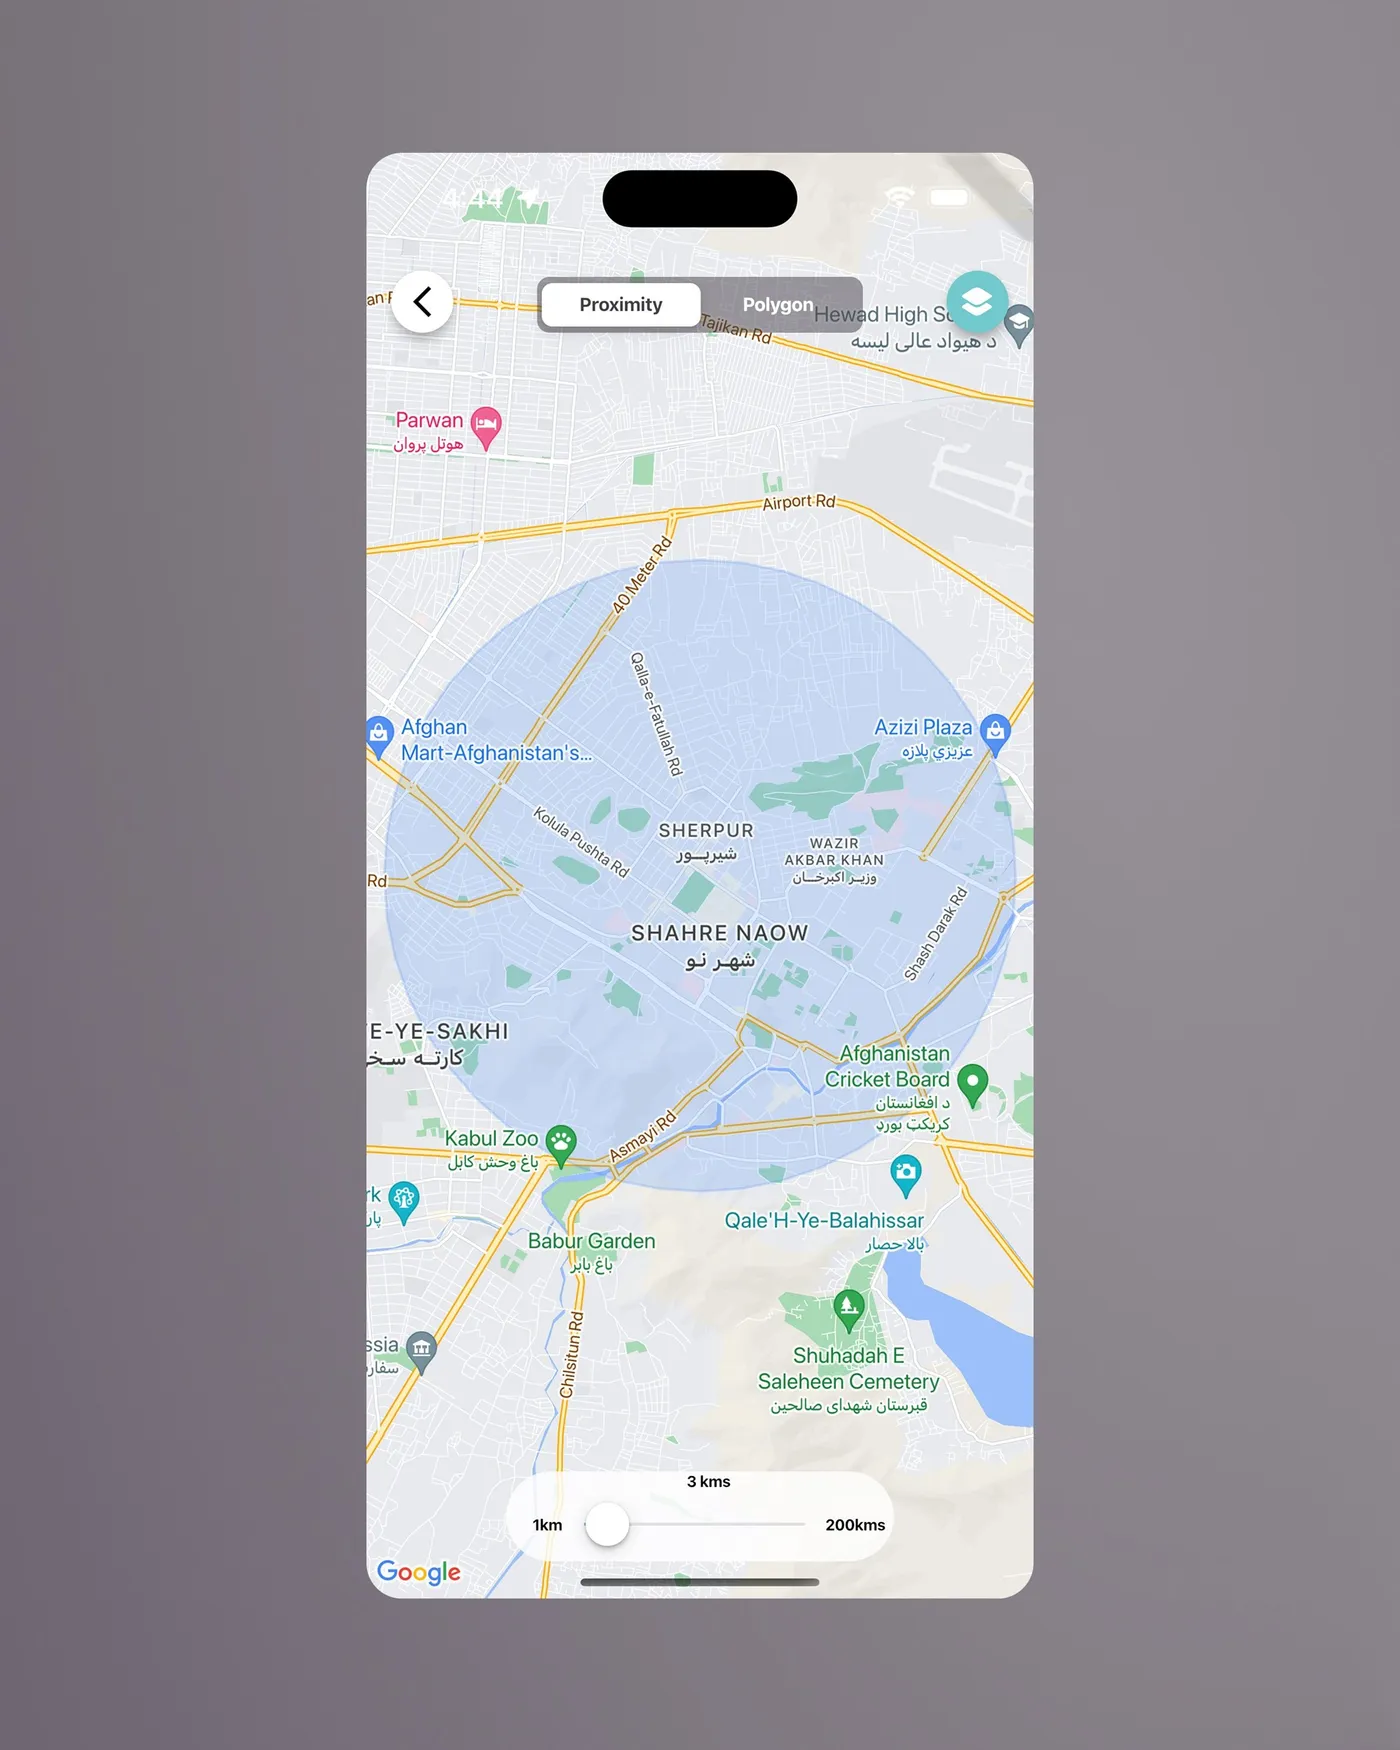
The old map had two tools, Proximity and Polygon. To look anywhere else, you had to open a single alert from the list and jump to its location.
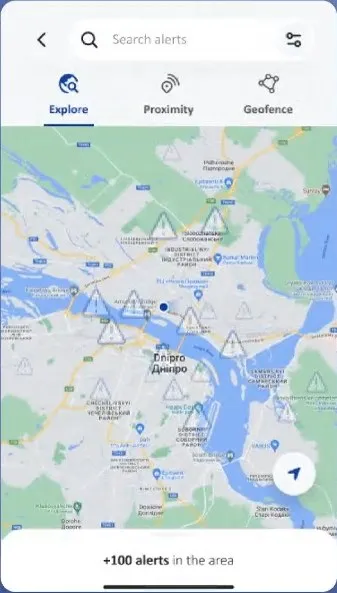
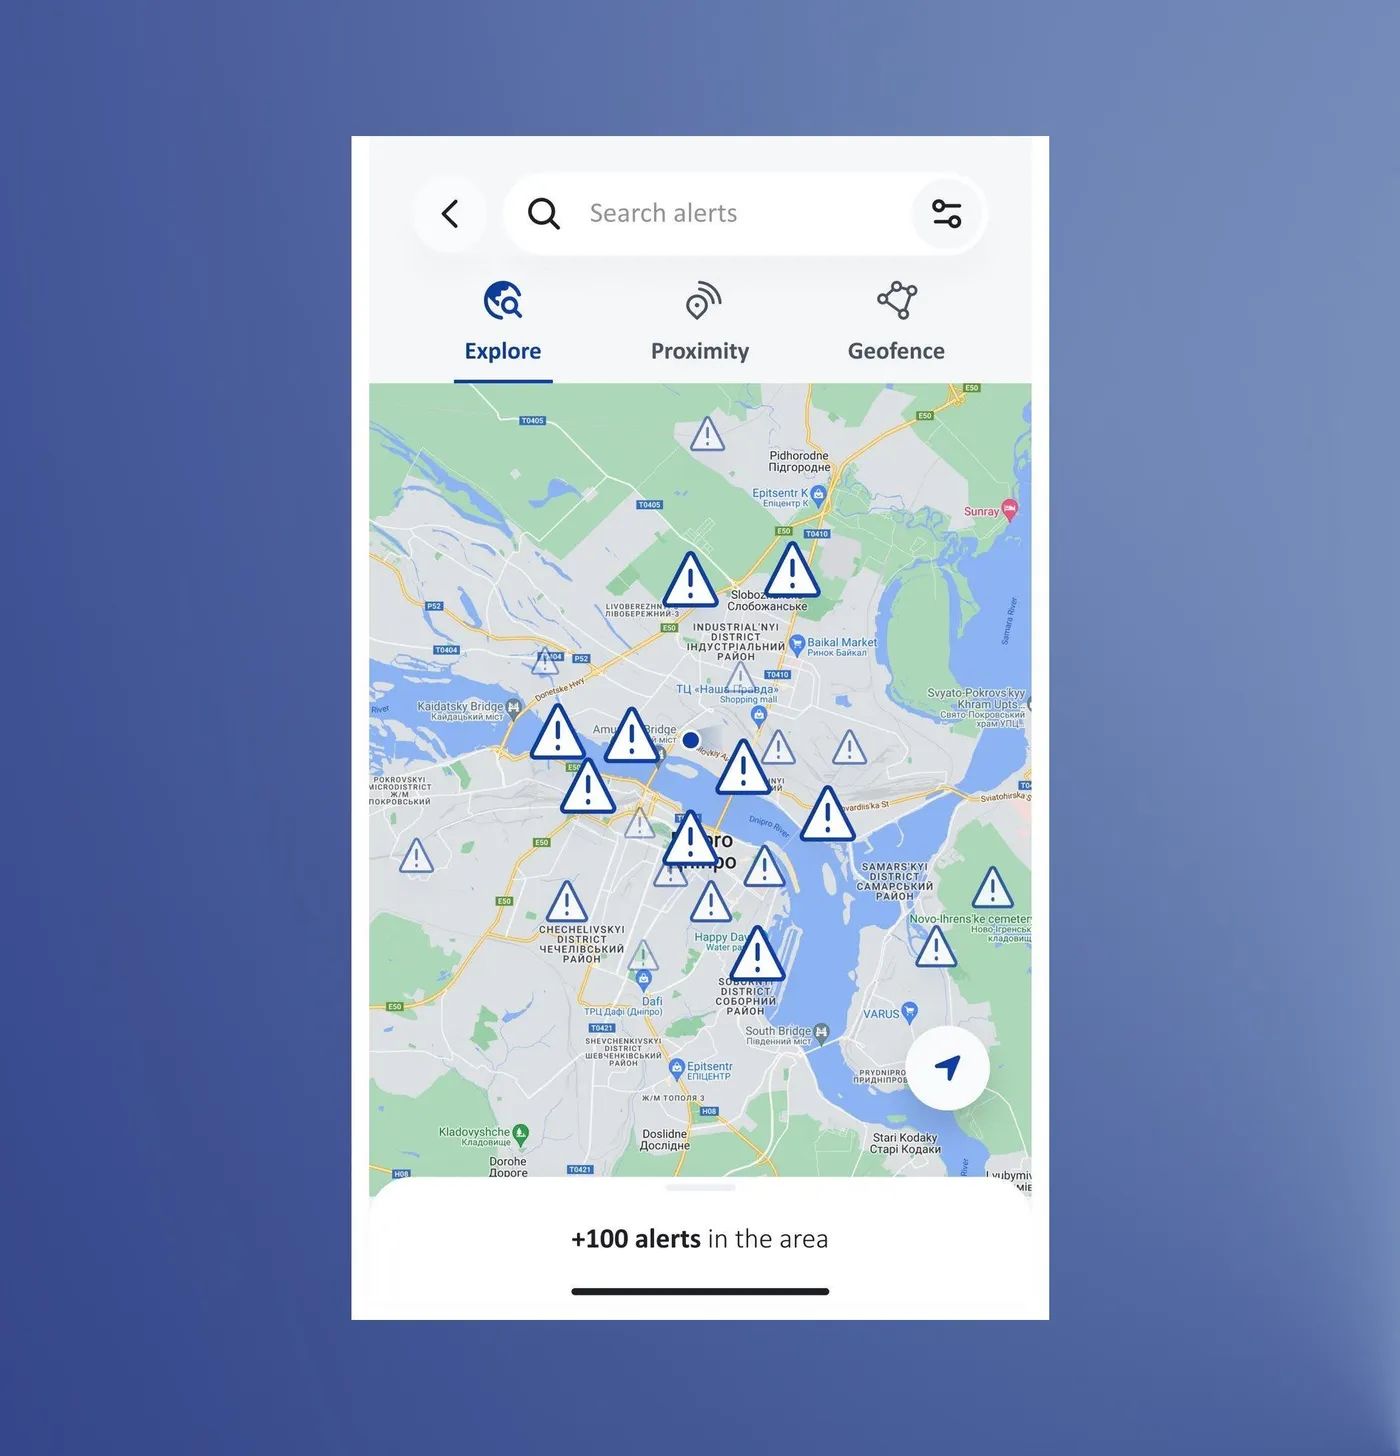
Explore: what's happening along my route?
A heuristic evaluation of the old map turned up three things that mattered here. You couldn't explore freely, because the map only opened as a tool for setting a radius or drawing an area. You couldn't select an alert on the map and read it there. And you couldn't move around the map and then switch back to the list to see only the alerts from the place you had moved to.
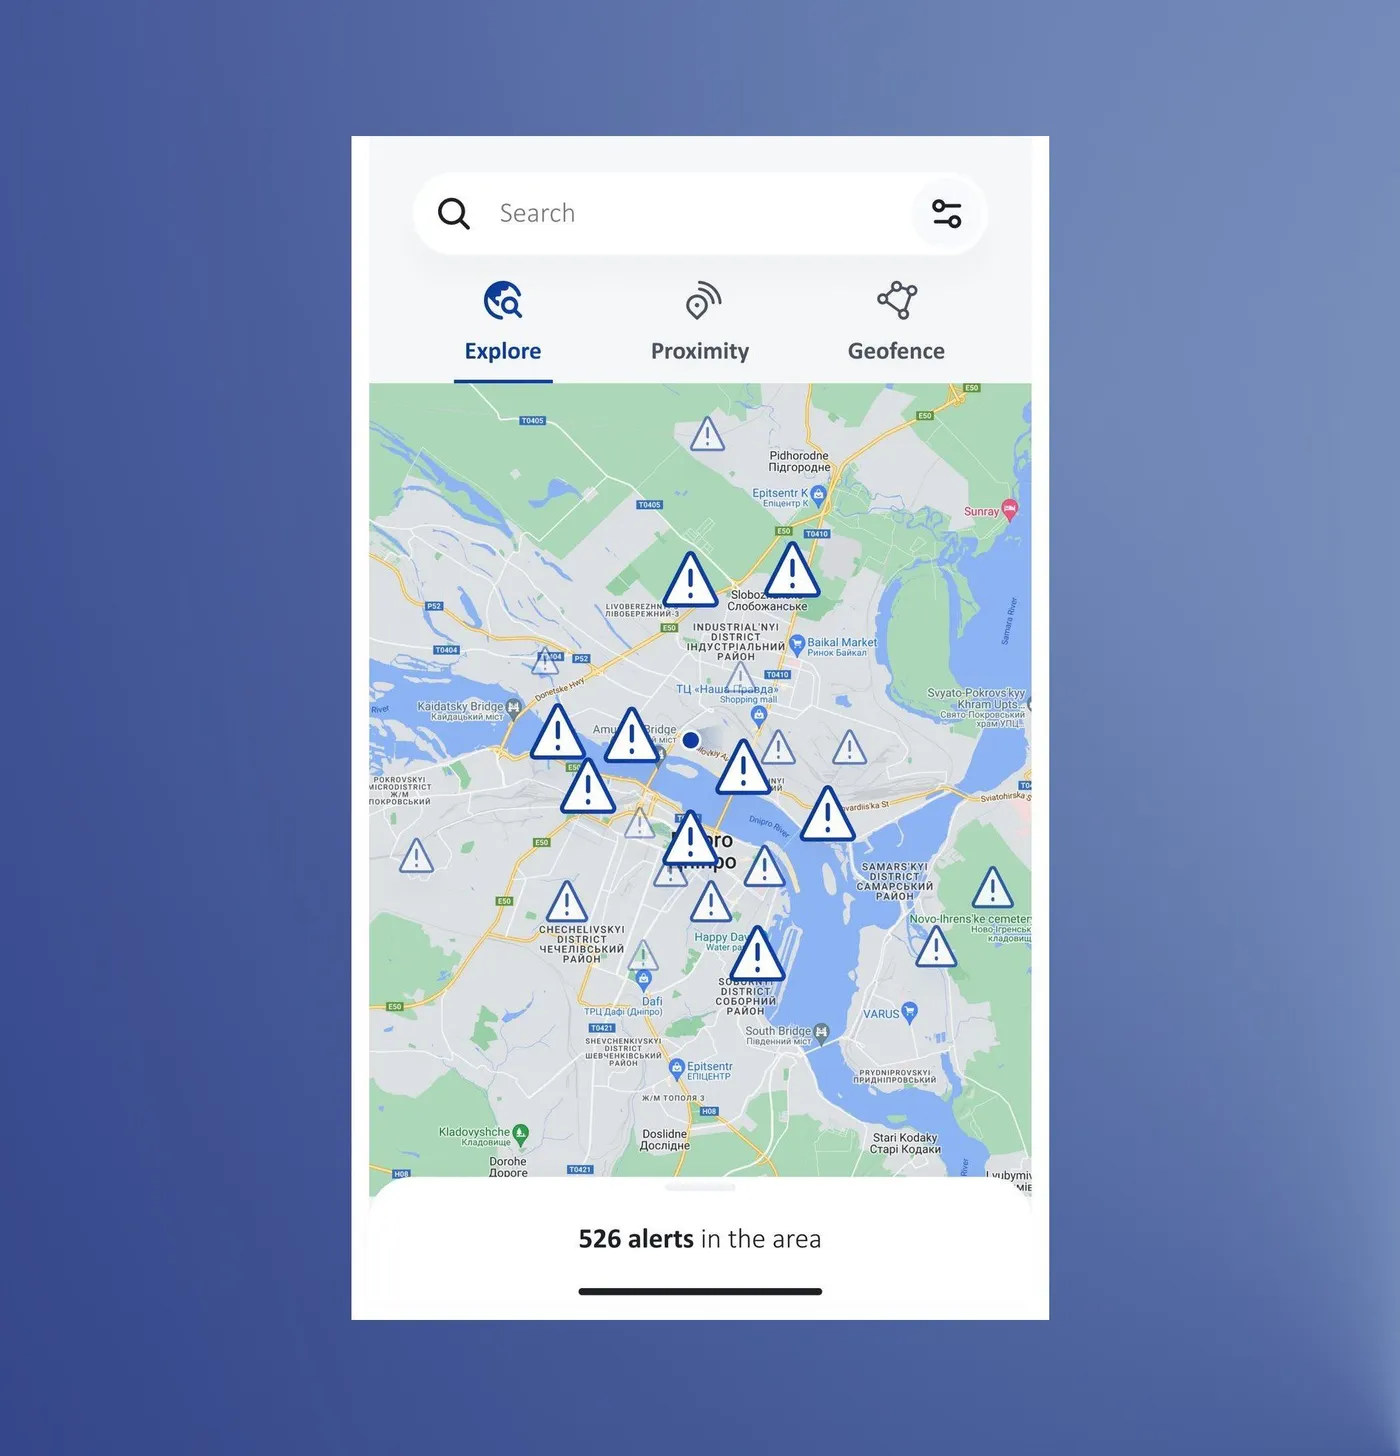
Explore fixes all three. You can move around the map freely, tap an alert to read its details on the map and open each one separately, and go to any place and switch back to the list to load the alerts from that area. None of this was possible in the former design, and it came from colleagues in the country offices who raised it when we tested. Testing also caught two smaller things: scrolling an alert also moved the map, and alerts without a location never showed up on it, so list and map counts didn't match.
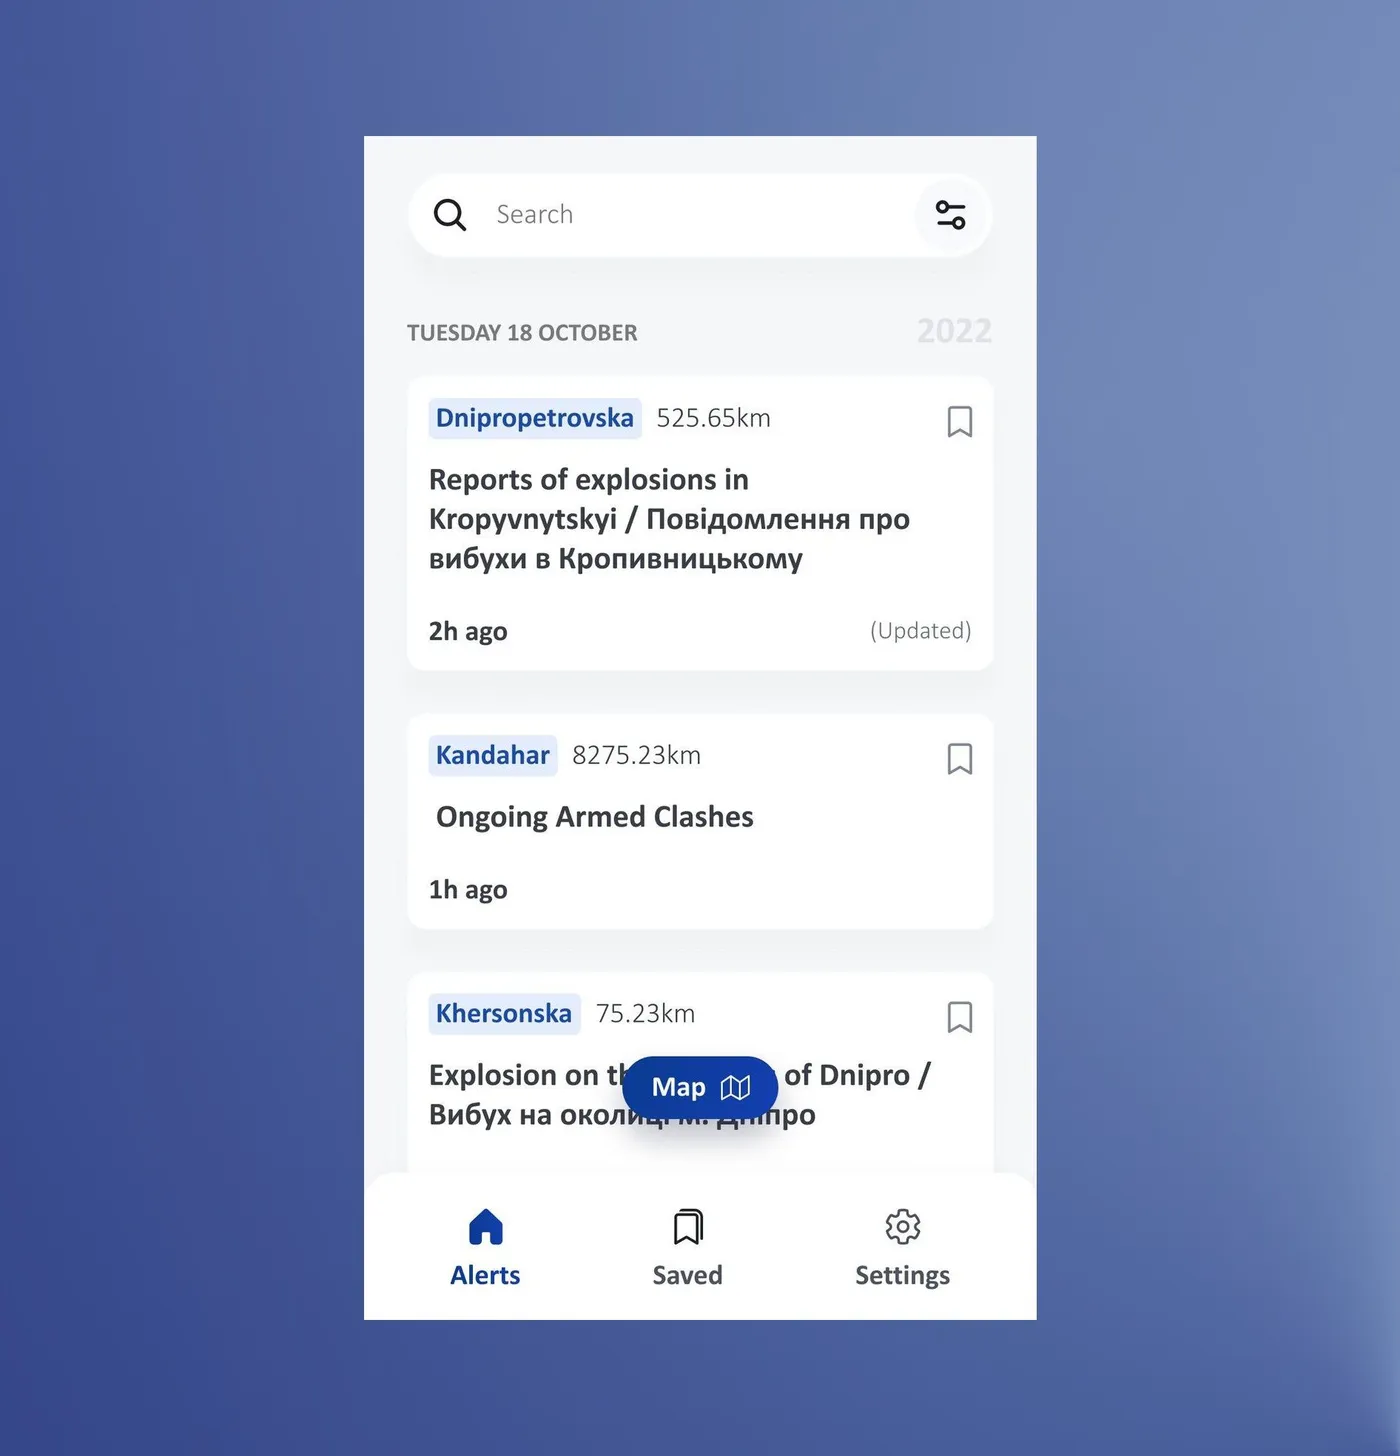
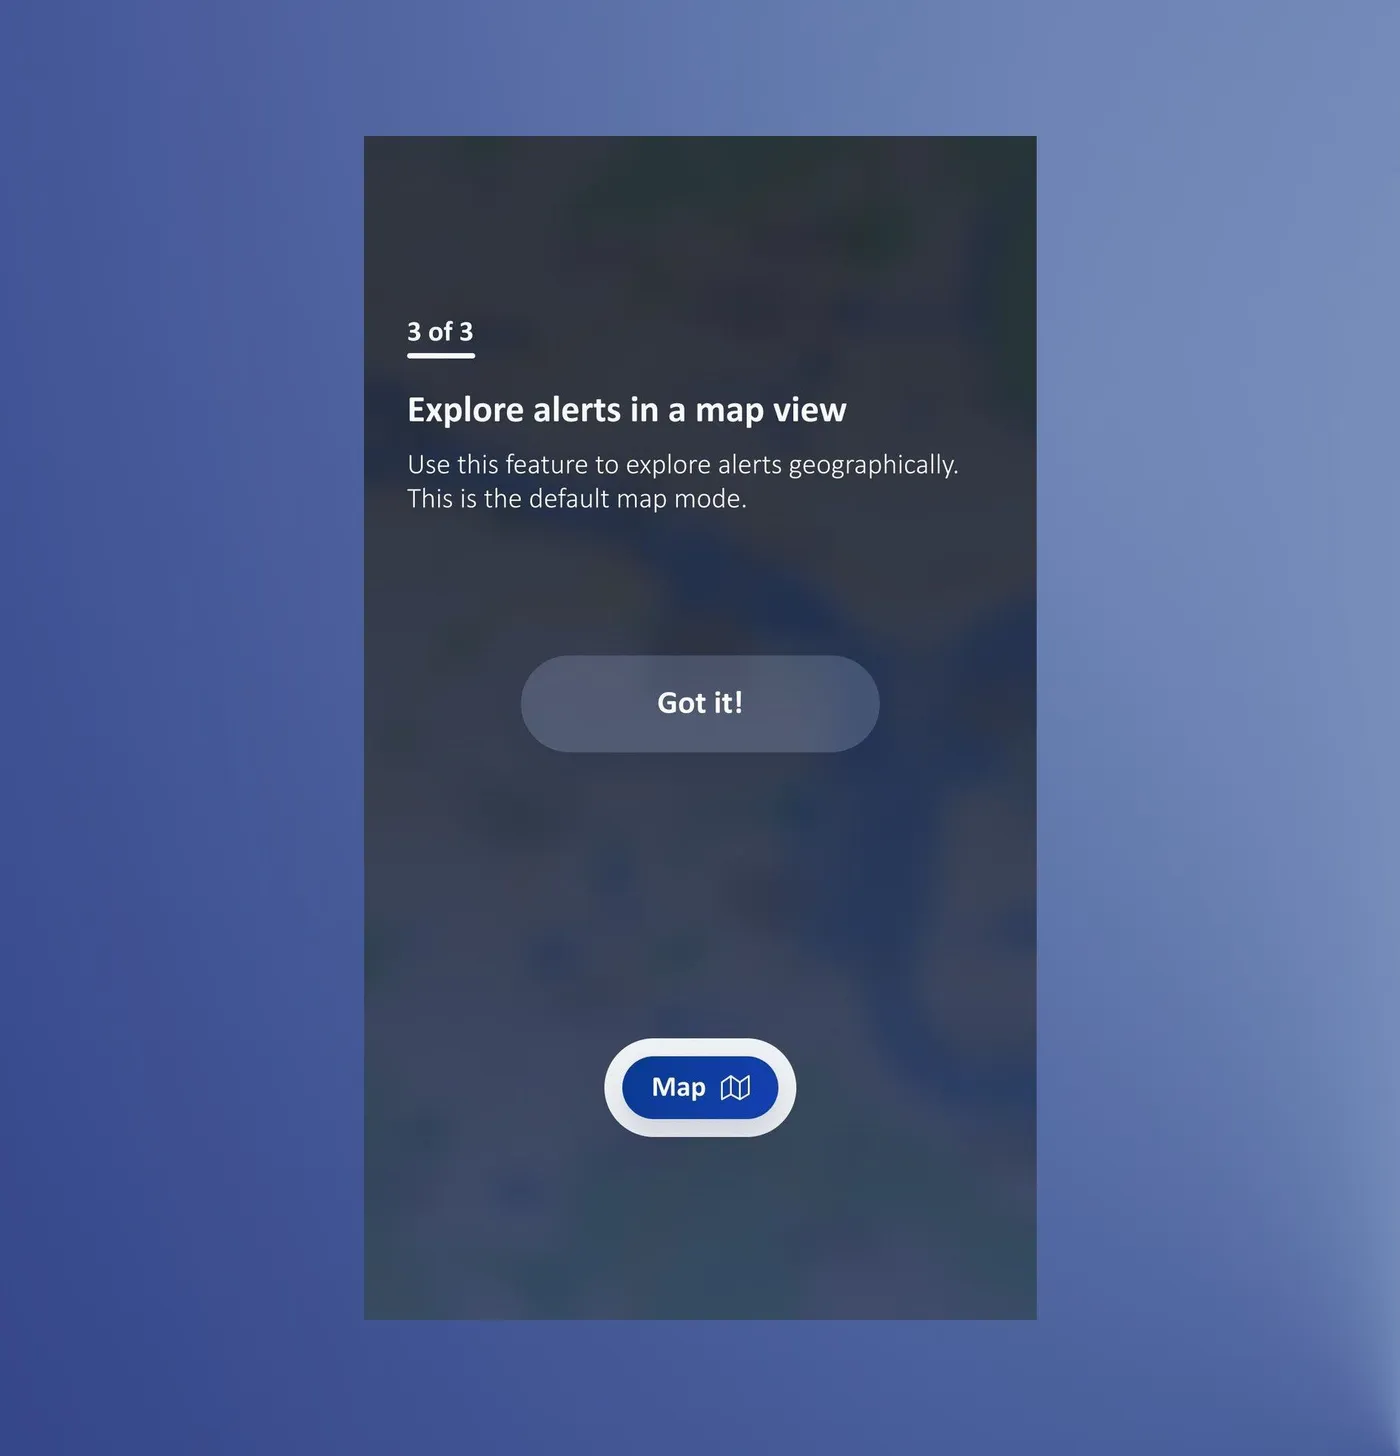
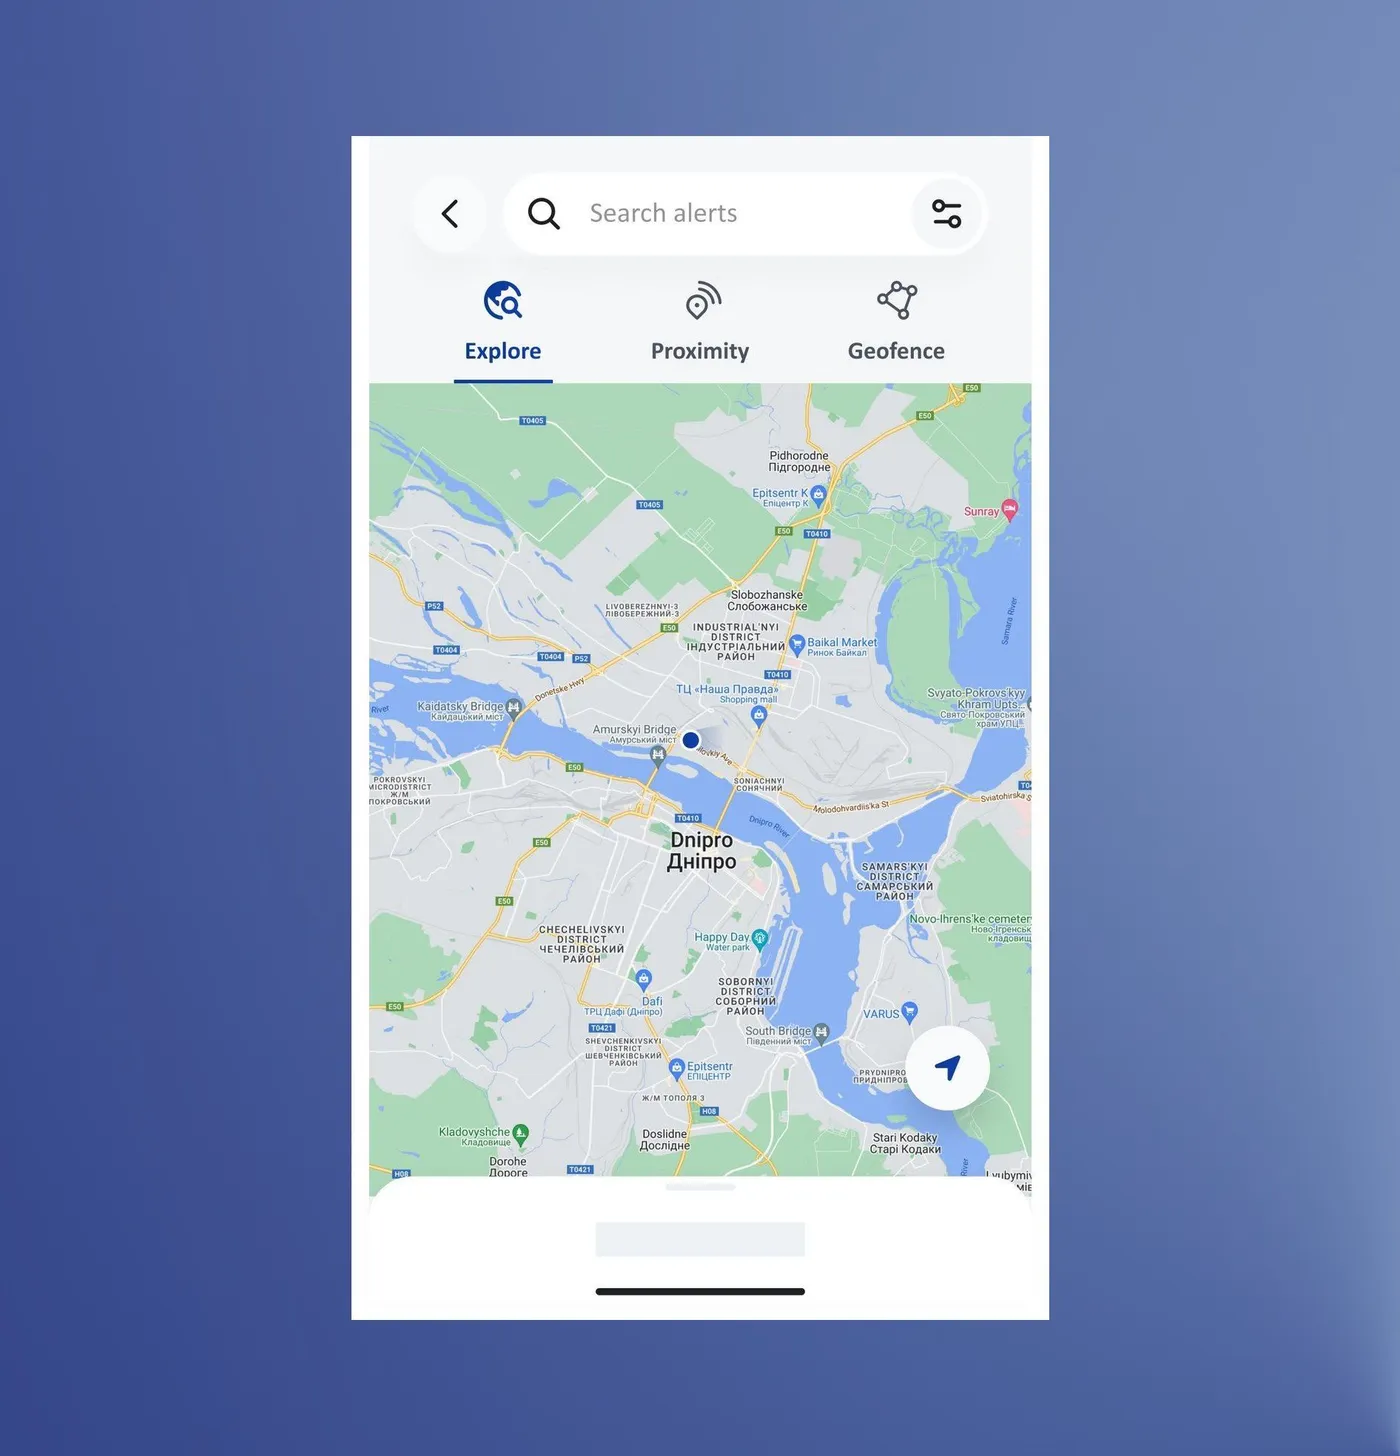
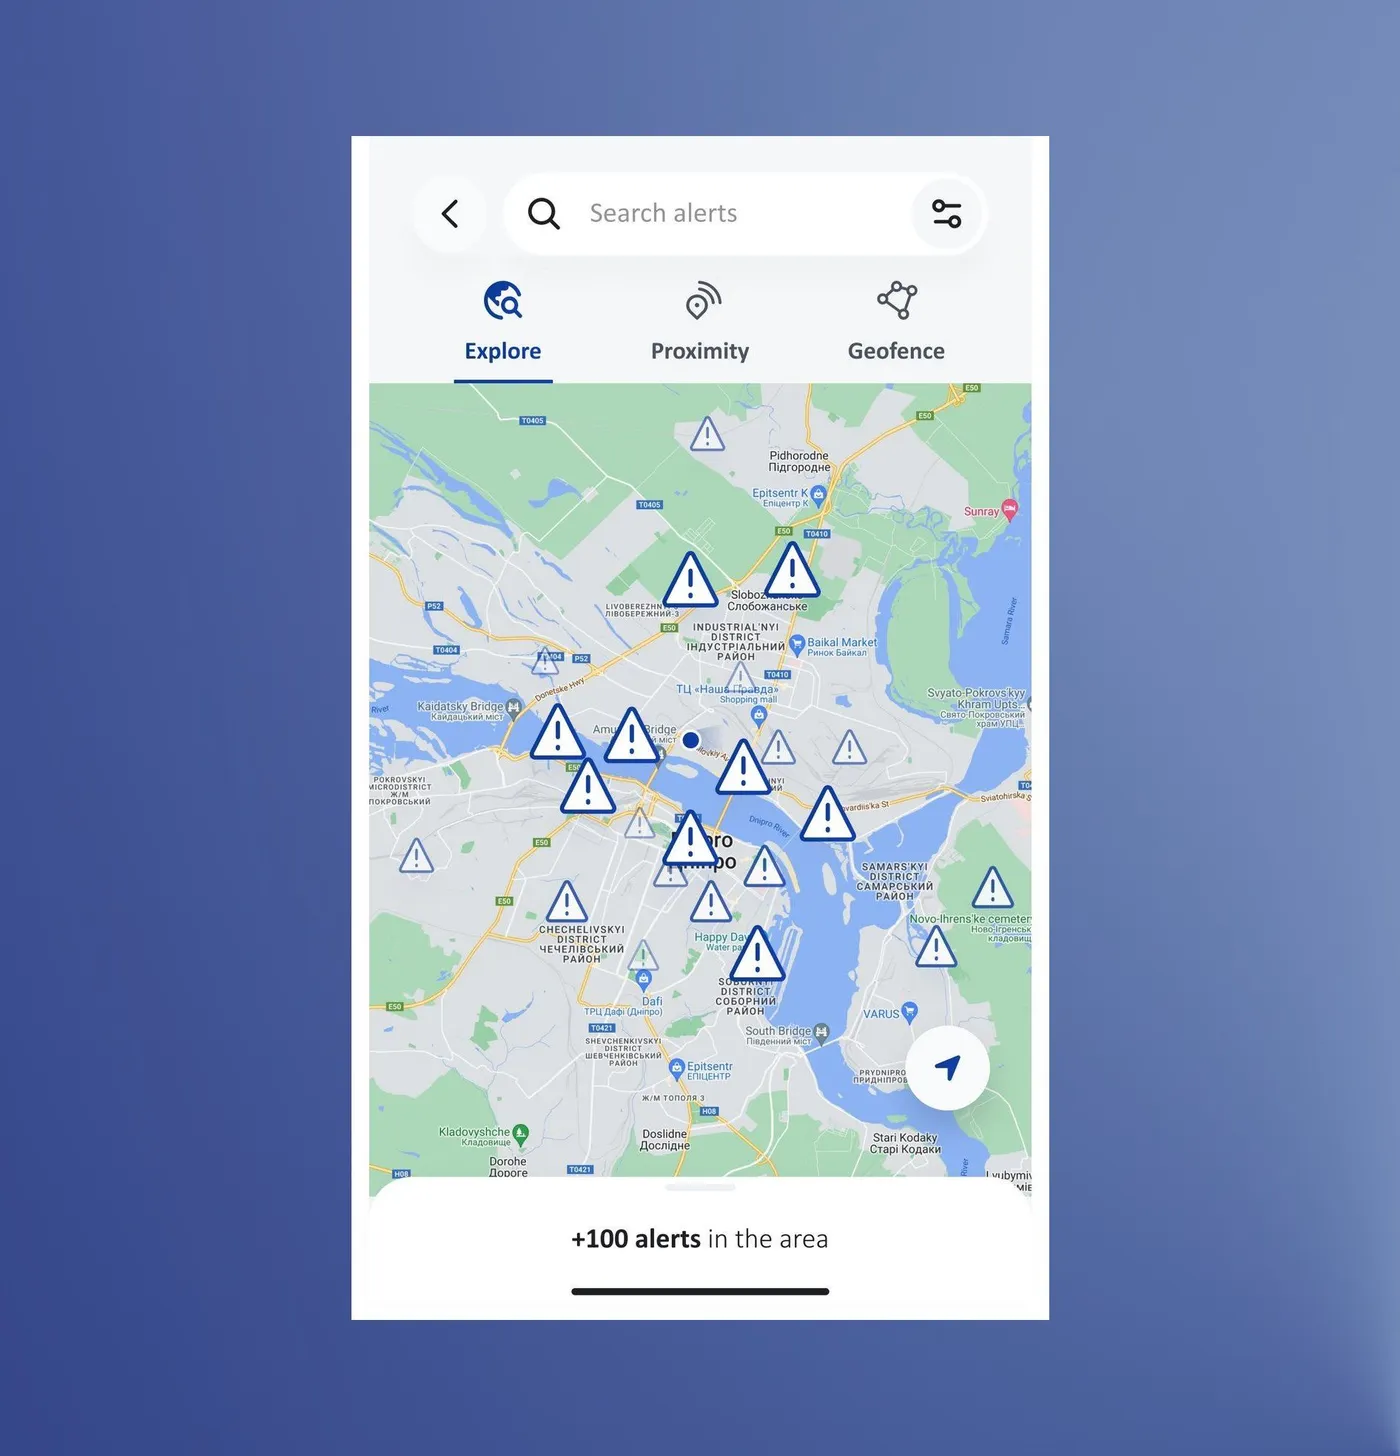
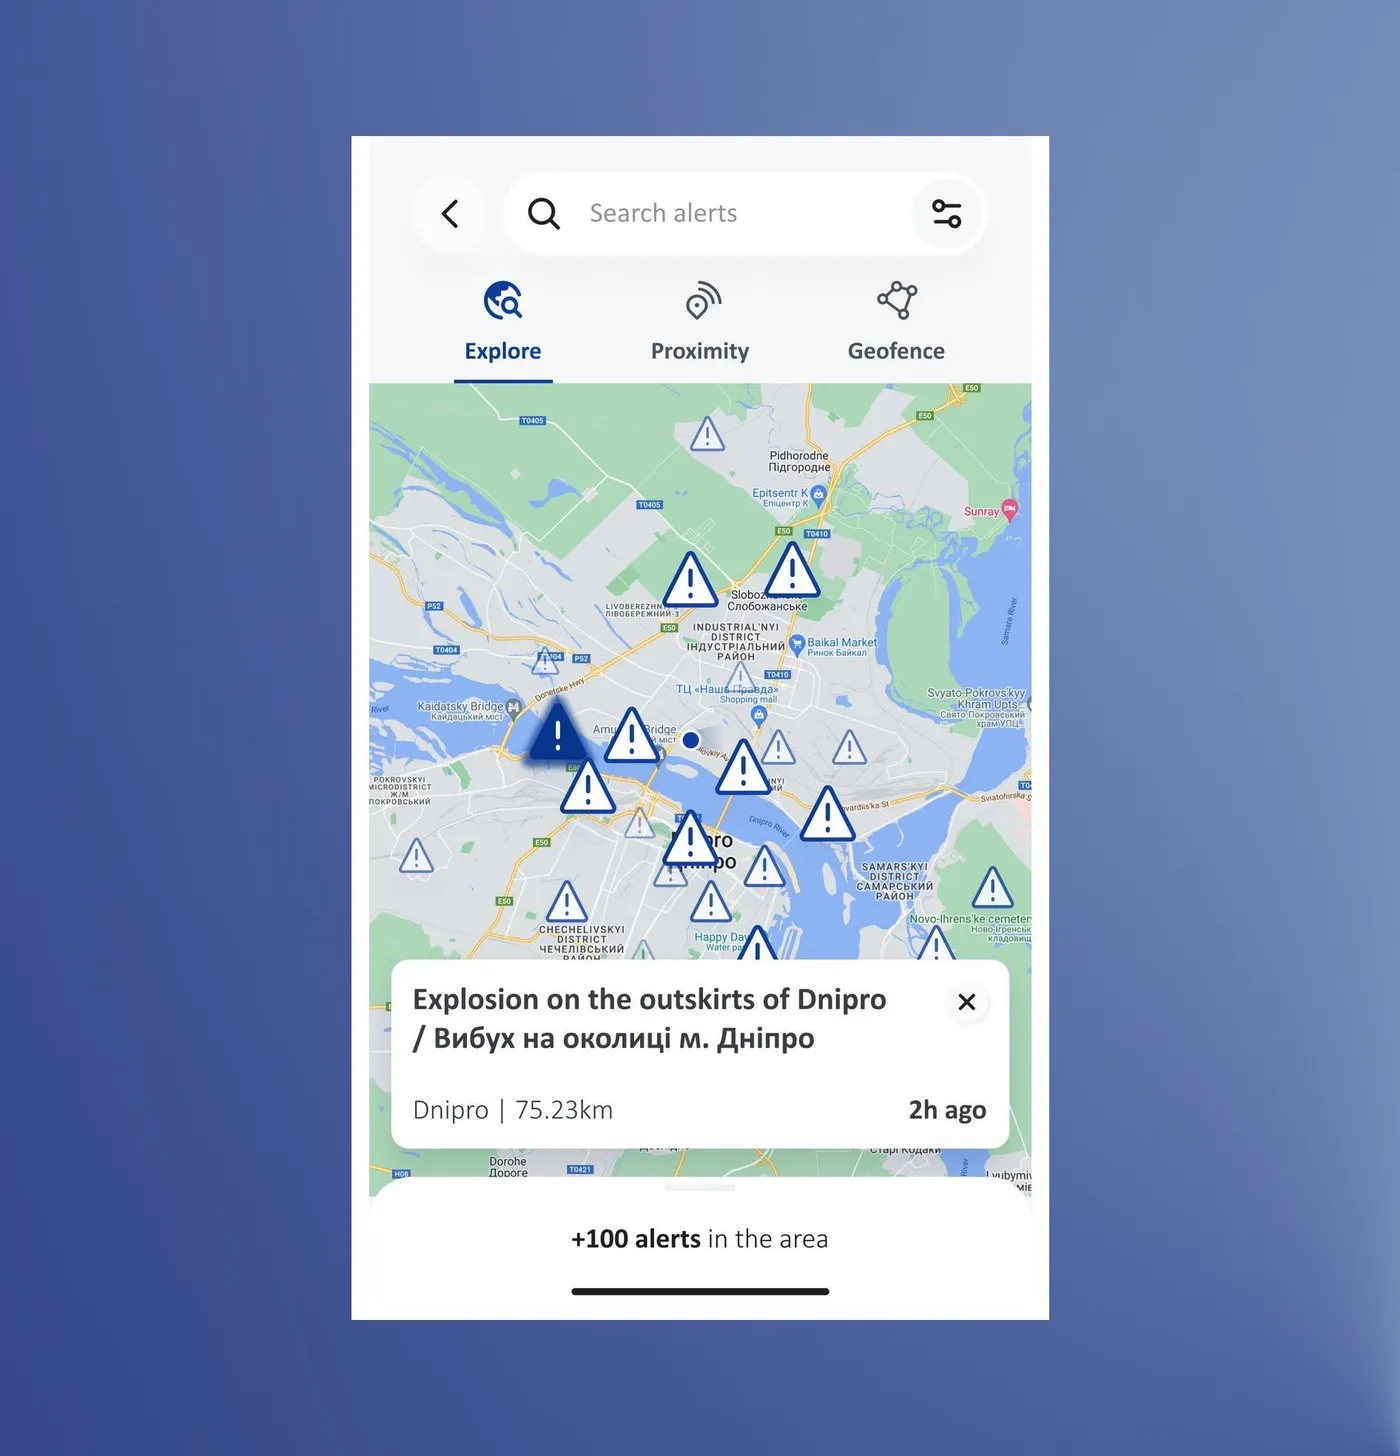
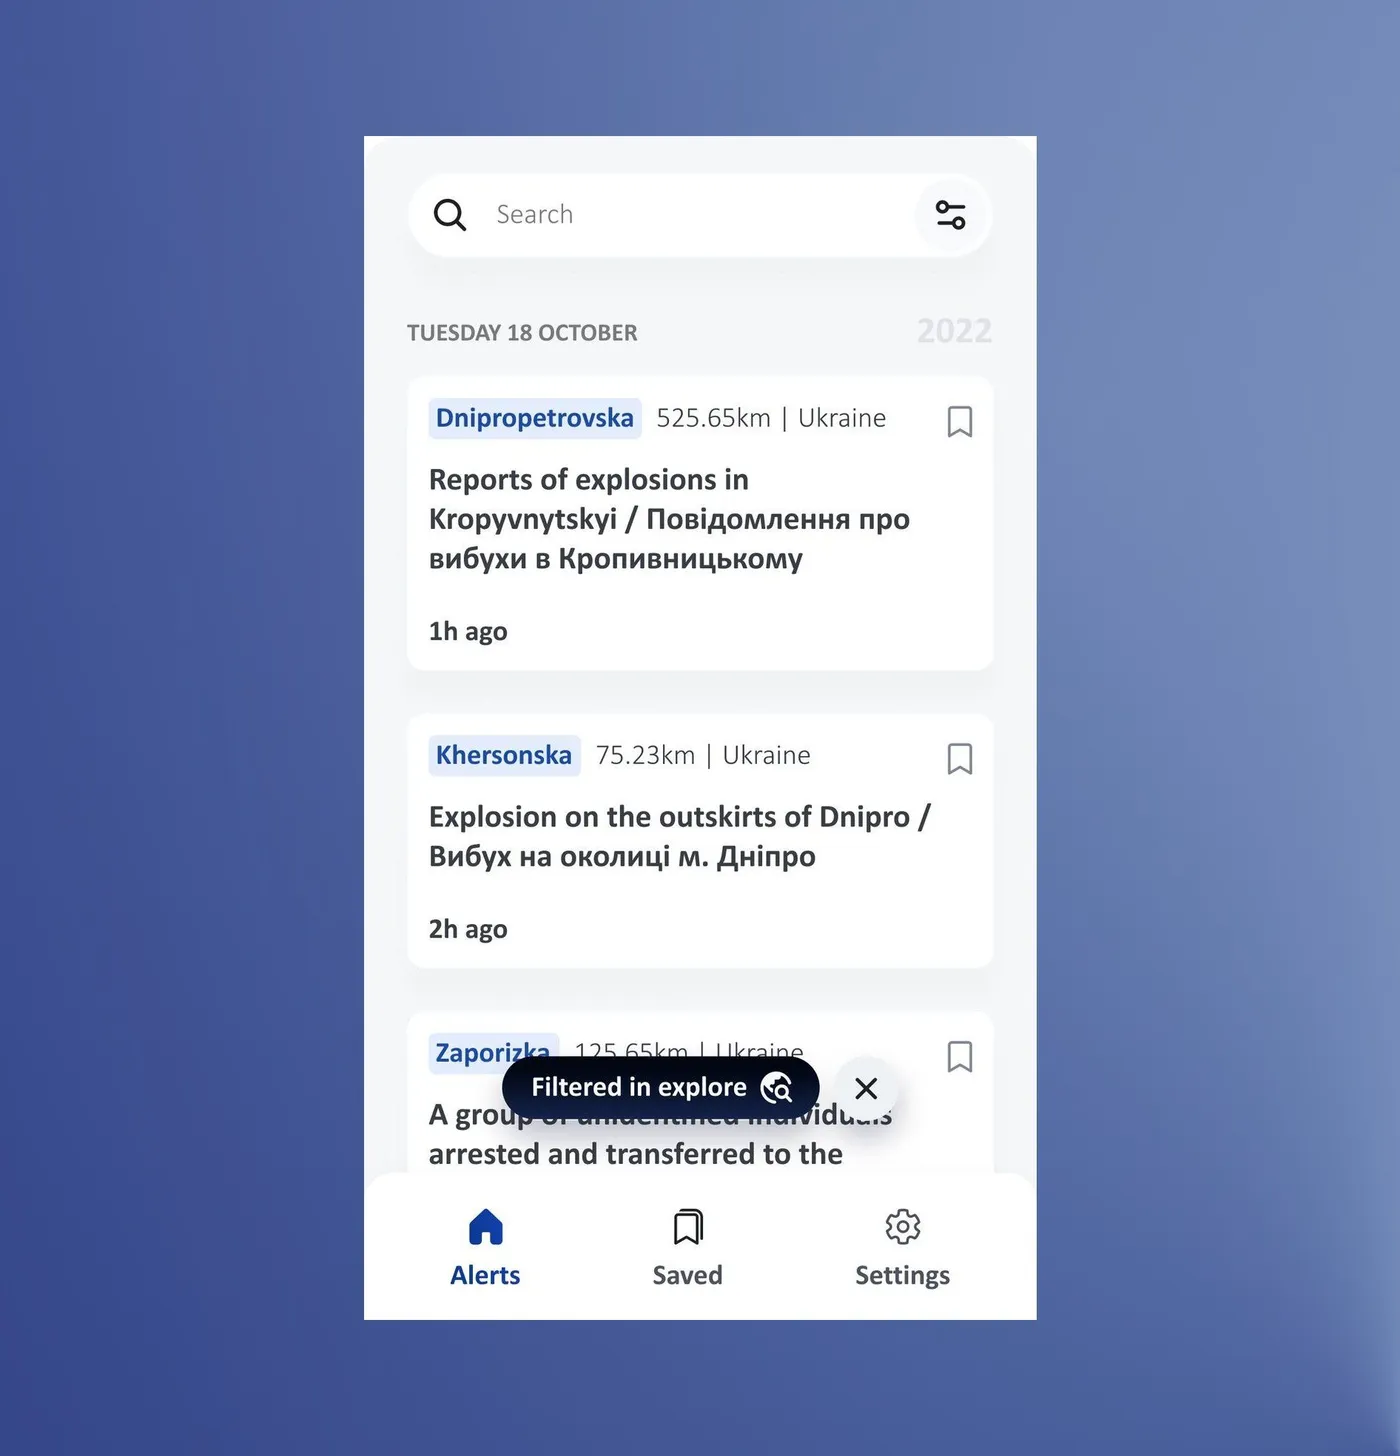
Testers found the map from the alerts list and explored it freely, with no drop-offs.
8 of 8 completed · 33 s on average · ease 8.6/10 · Maze test with country office colleagues
Proximity: I'm not in the area I want to monitor.
Can I still stay informed?
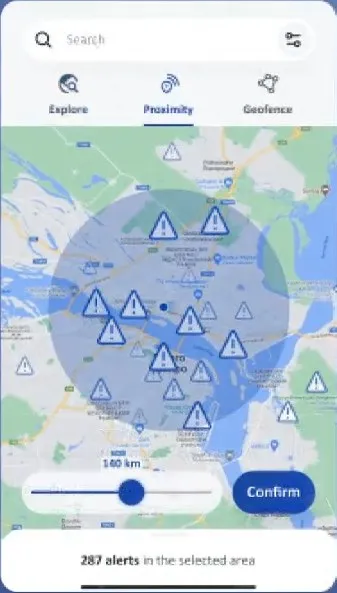
Proximity shows alerts within a radius of your live location, or of a pin you drop somewhere else. The first version had two ways to set that radius: on the map, and with a slider in the filter menu a bit like dating apps do. Most testers went to the map through the Map button on the alerts list, so the slider went and the radius now lives in one place.
6 test participants were able to set a radius around a place they weren't in, in 53 seconds on average, with an ease score of 6.8 out of 10.
Maze test with country office colleagues
While the participants were thinking aloud during the test, I understood that most of them, if not all, read the little intro and voiced their understanding of the proximity mode. But it's one thing to understand something and another to know how to put it into practice. So I learned that the proximity intro needed to be a proper step-by-step tutorial. Nothing too extensive, to avoid killing engagement, but not a pure intro either, without showing how to use the mode.
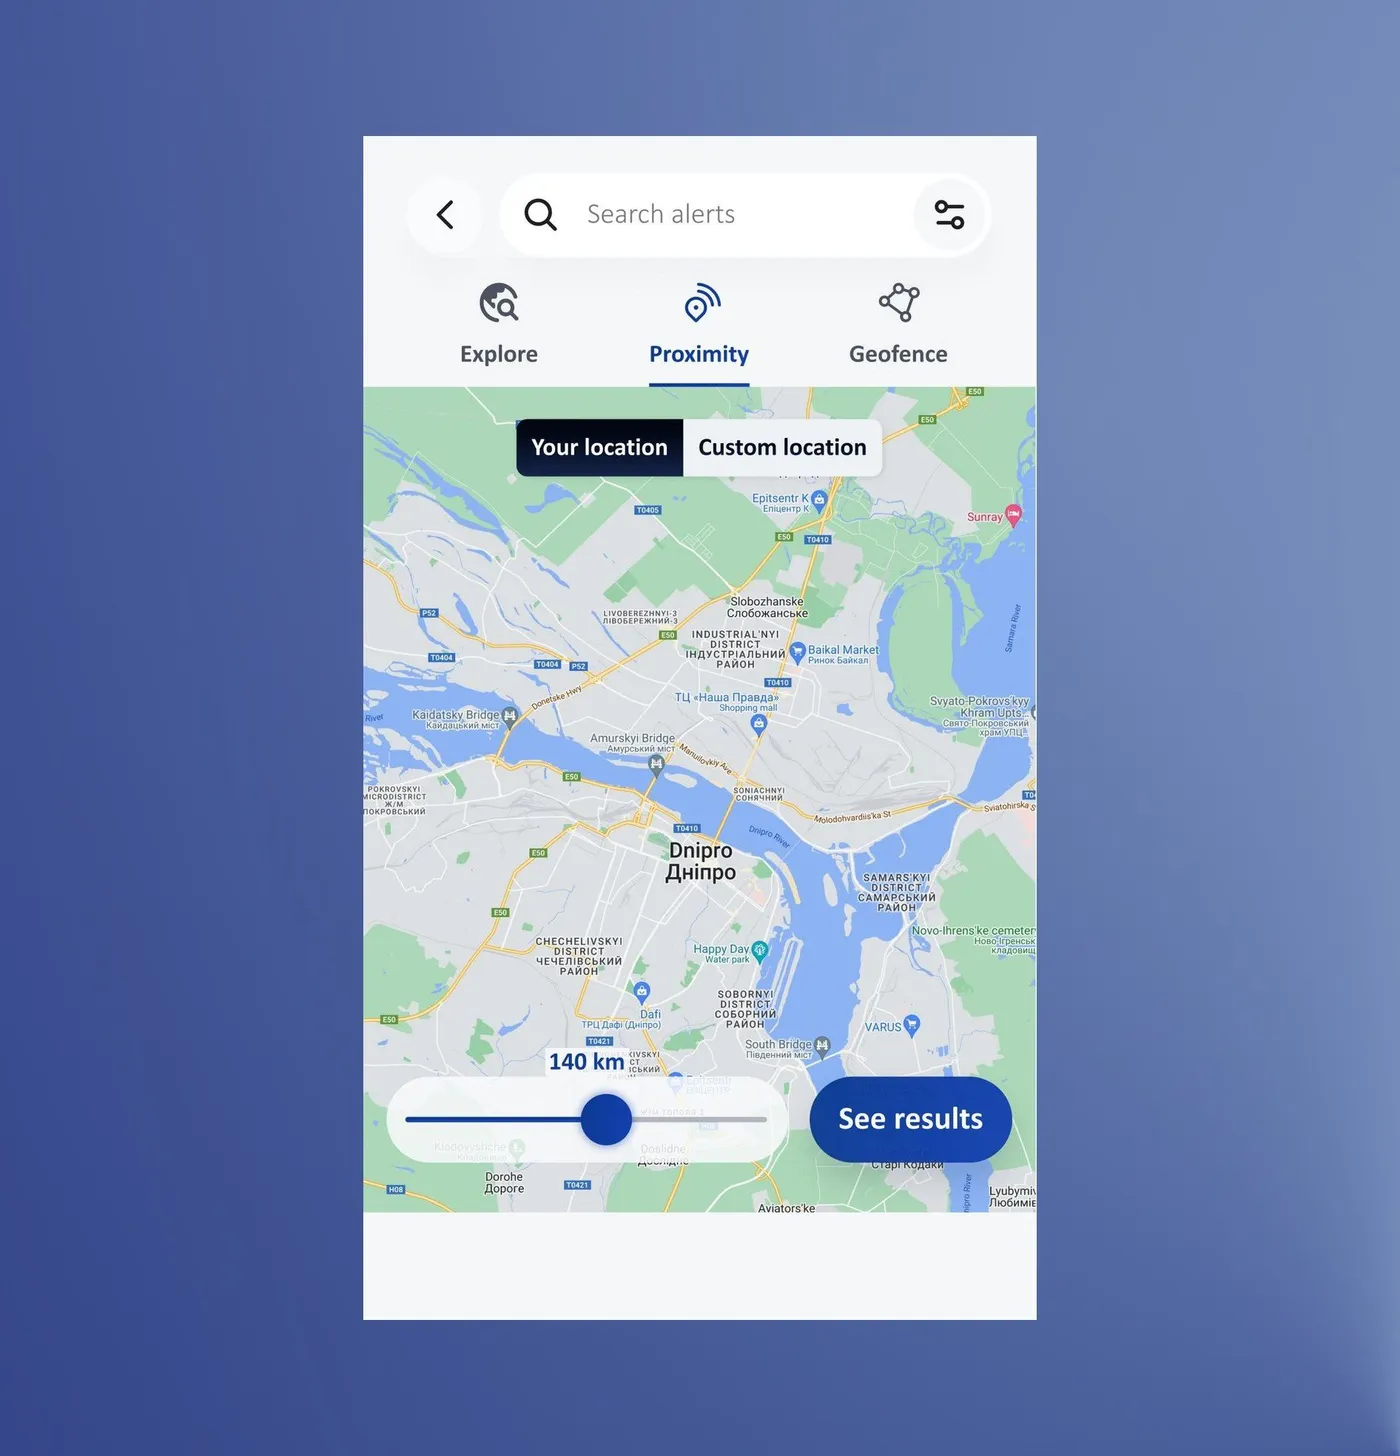
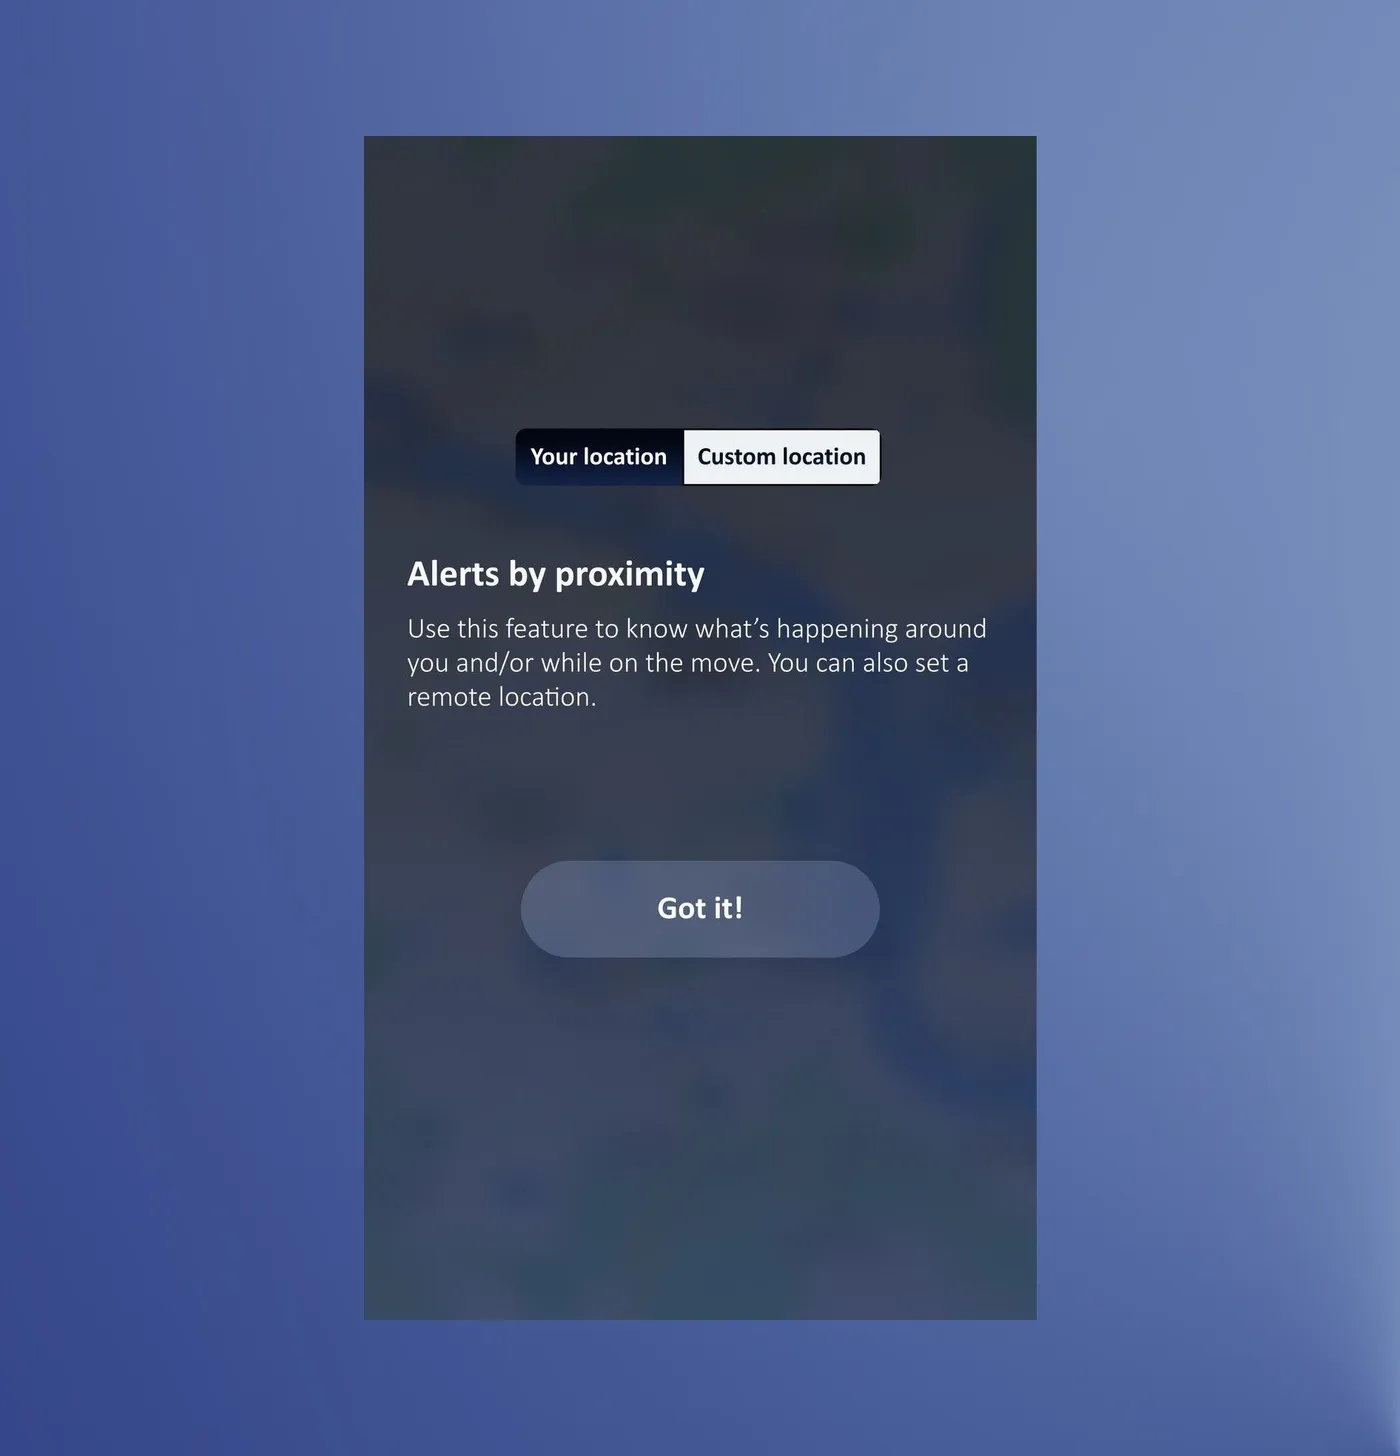
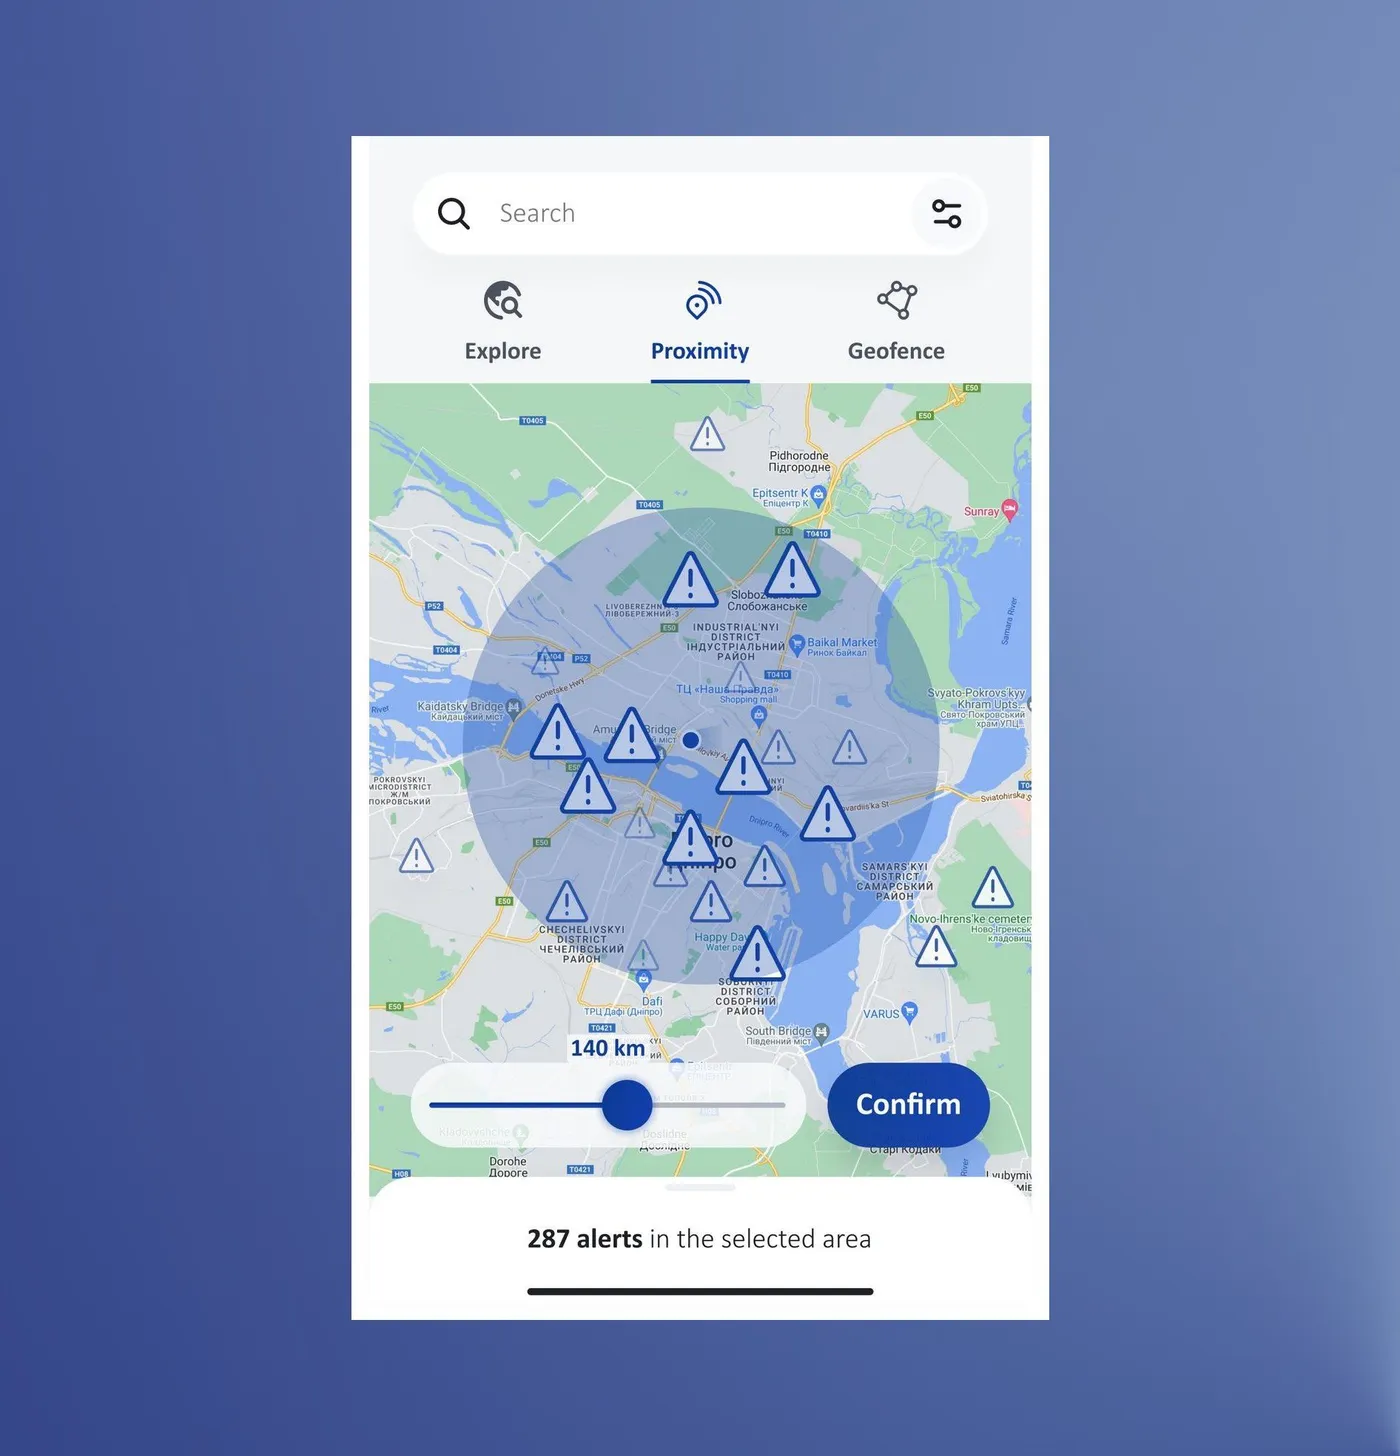
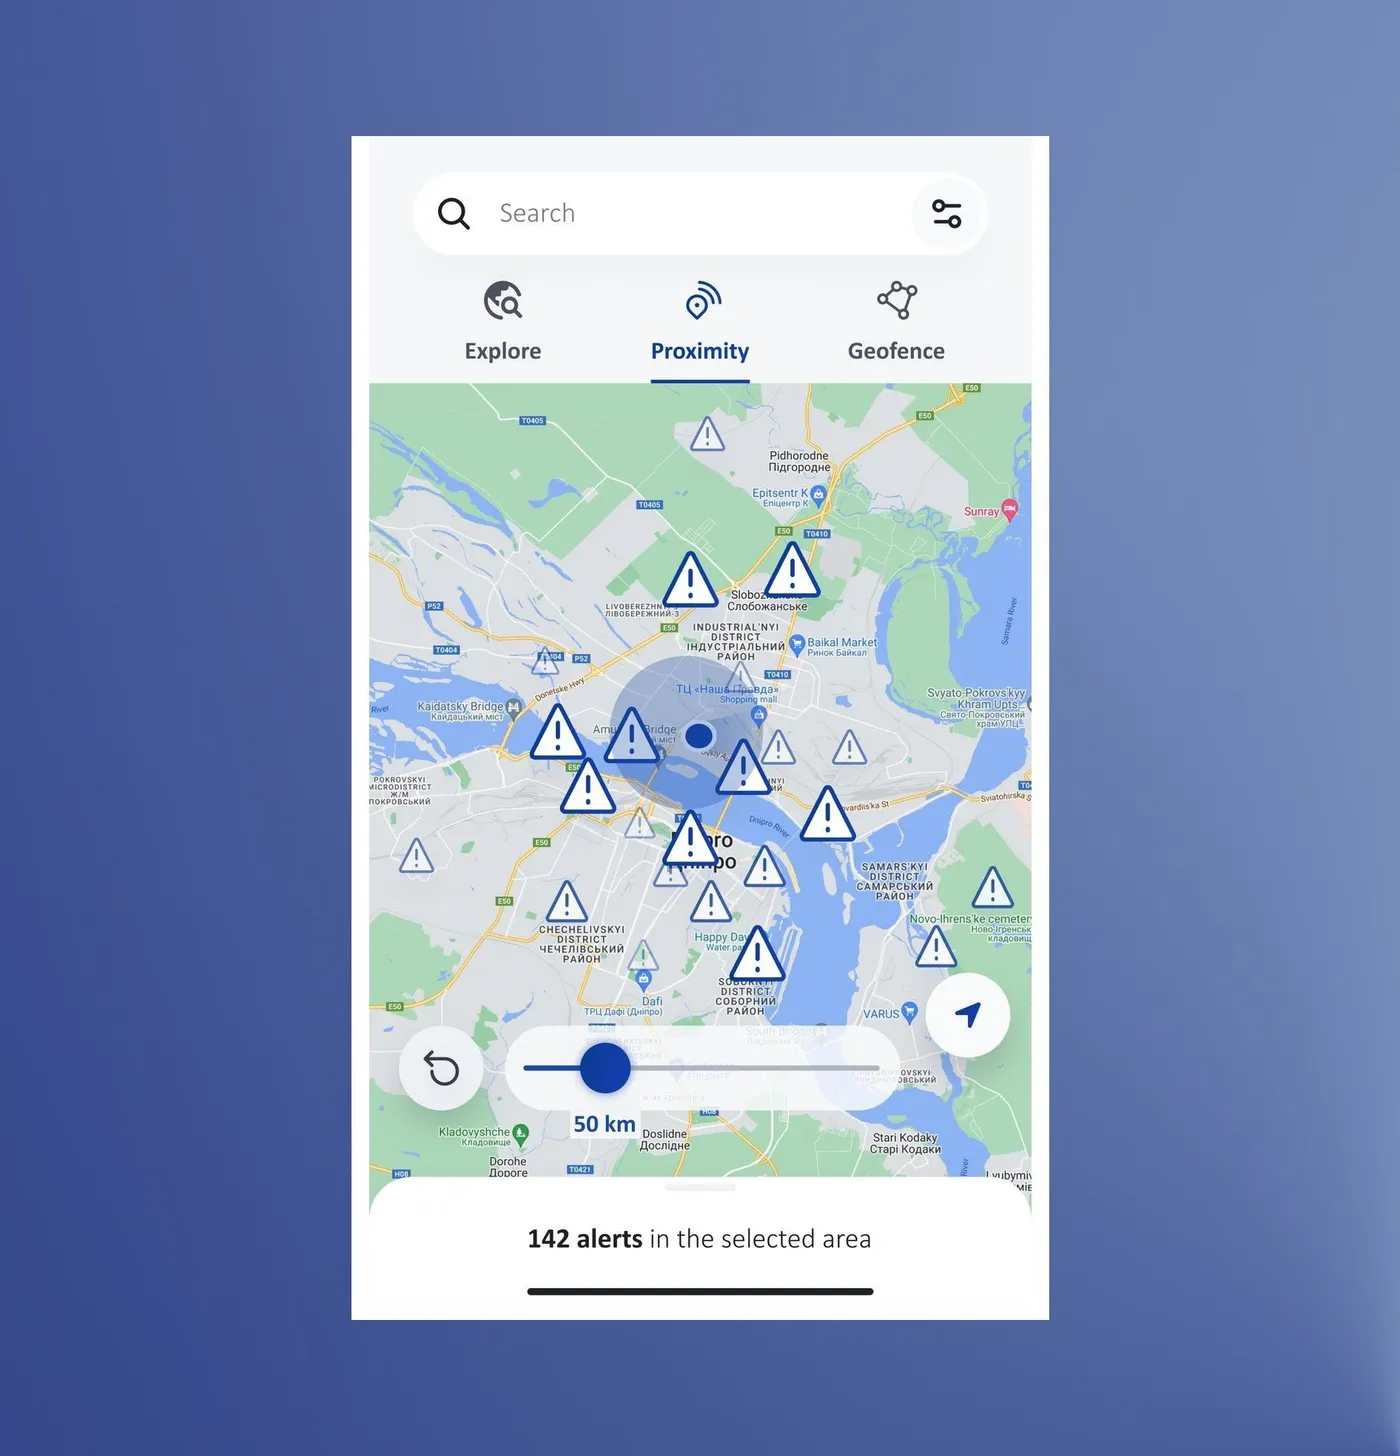
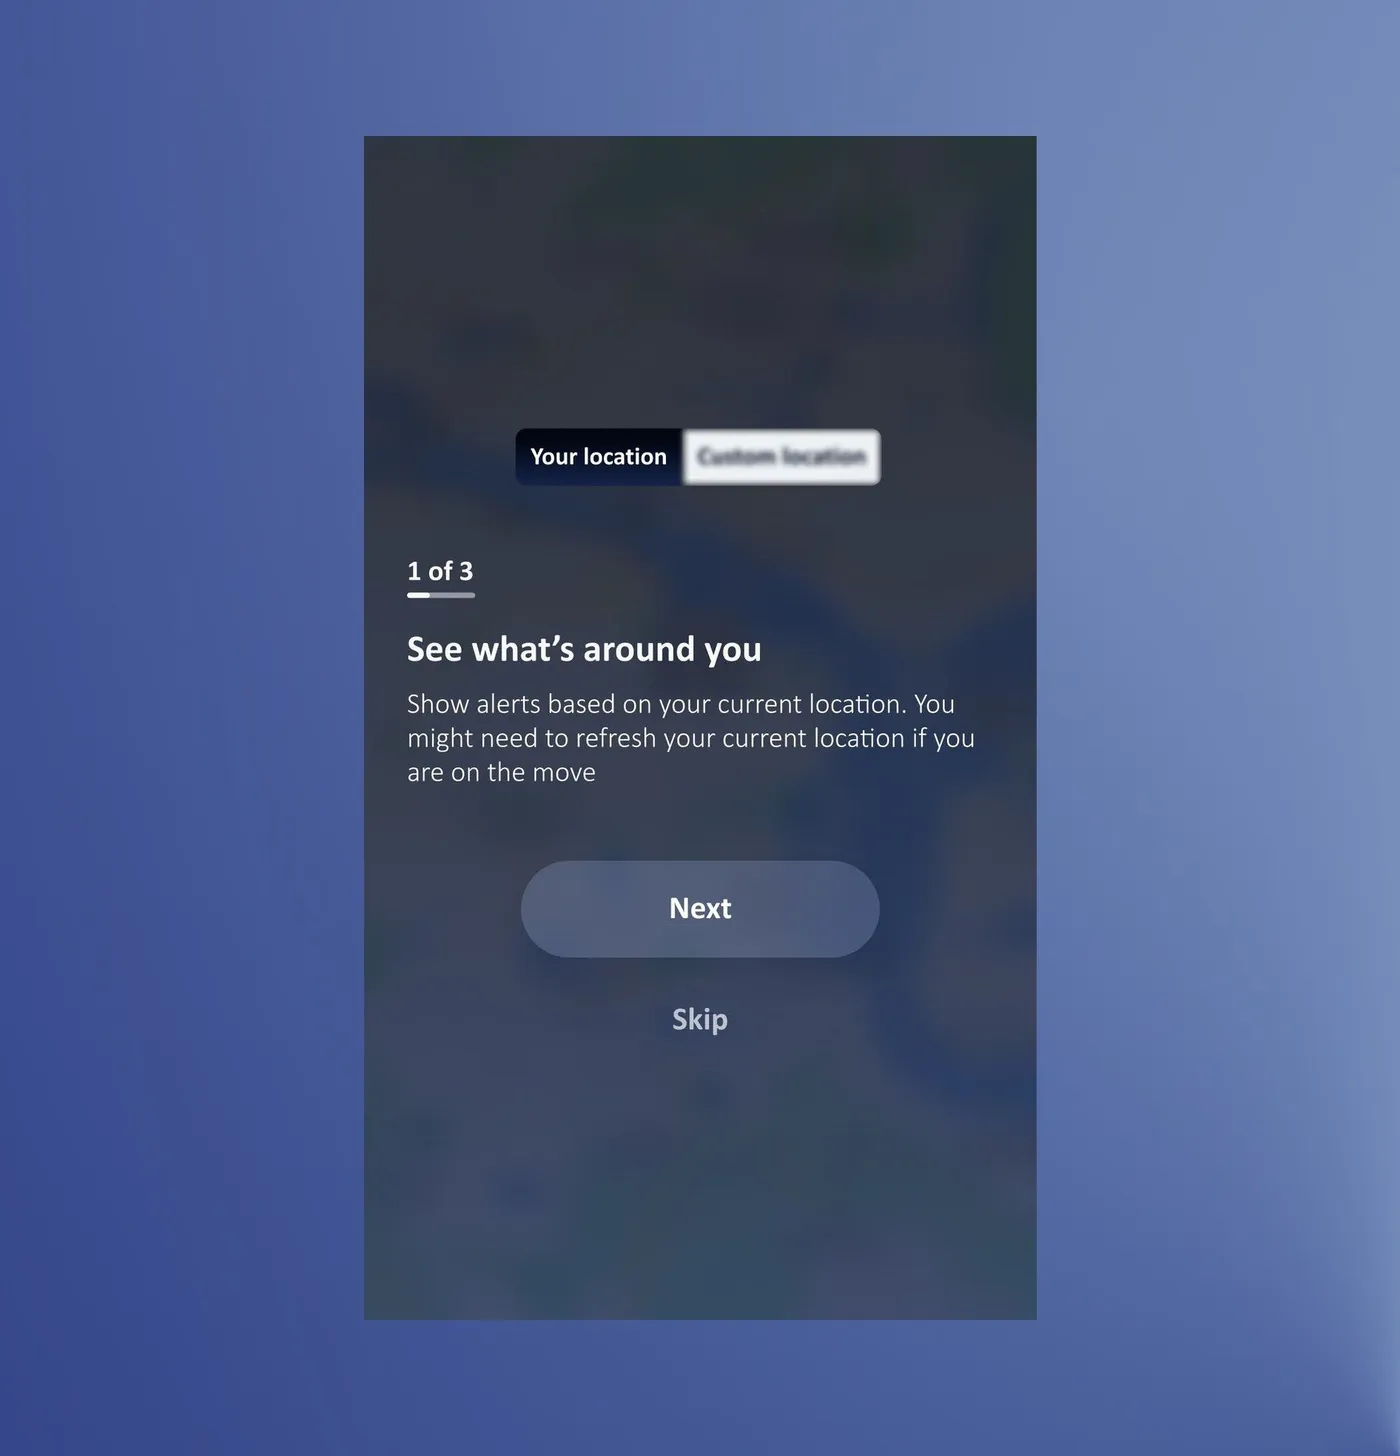
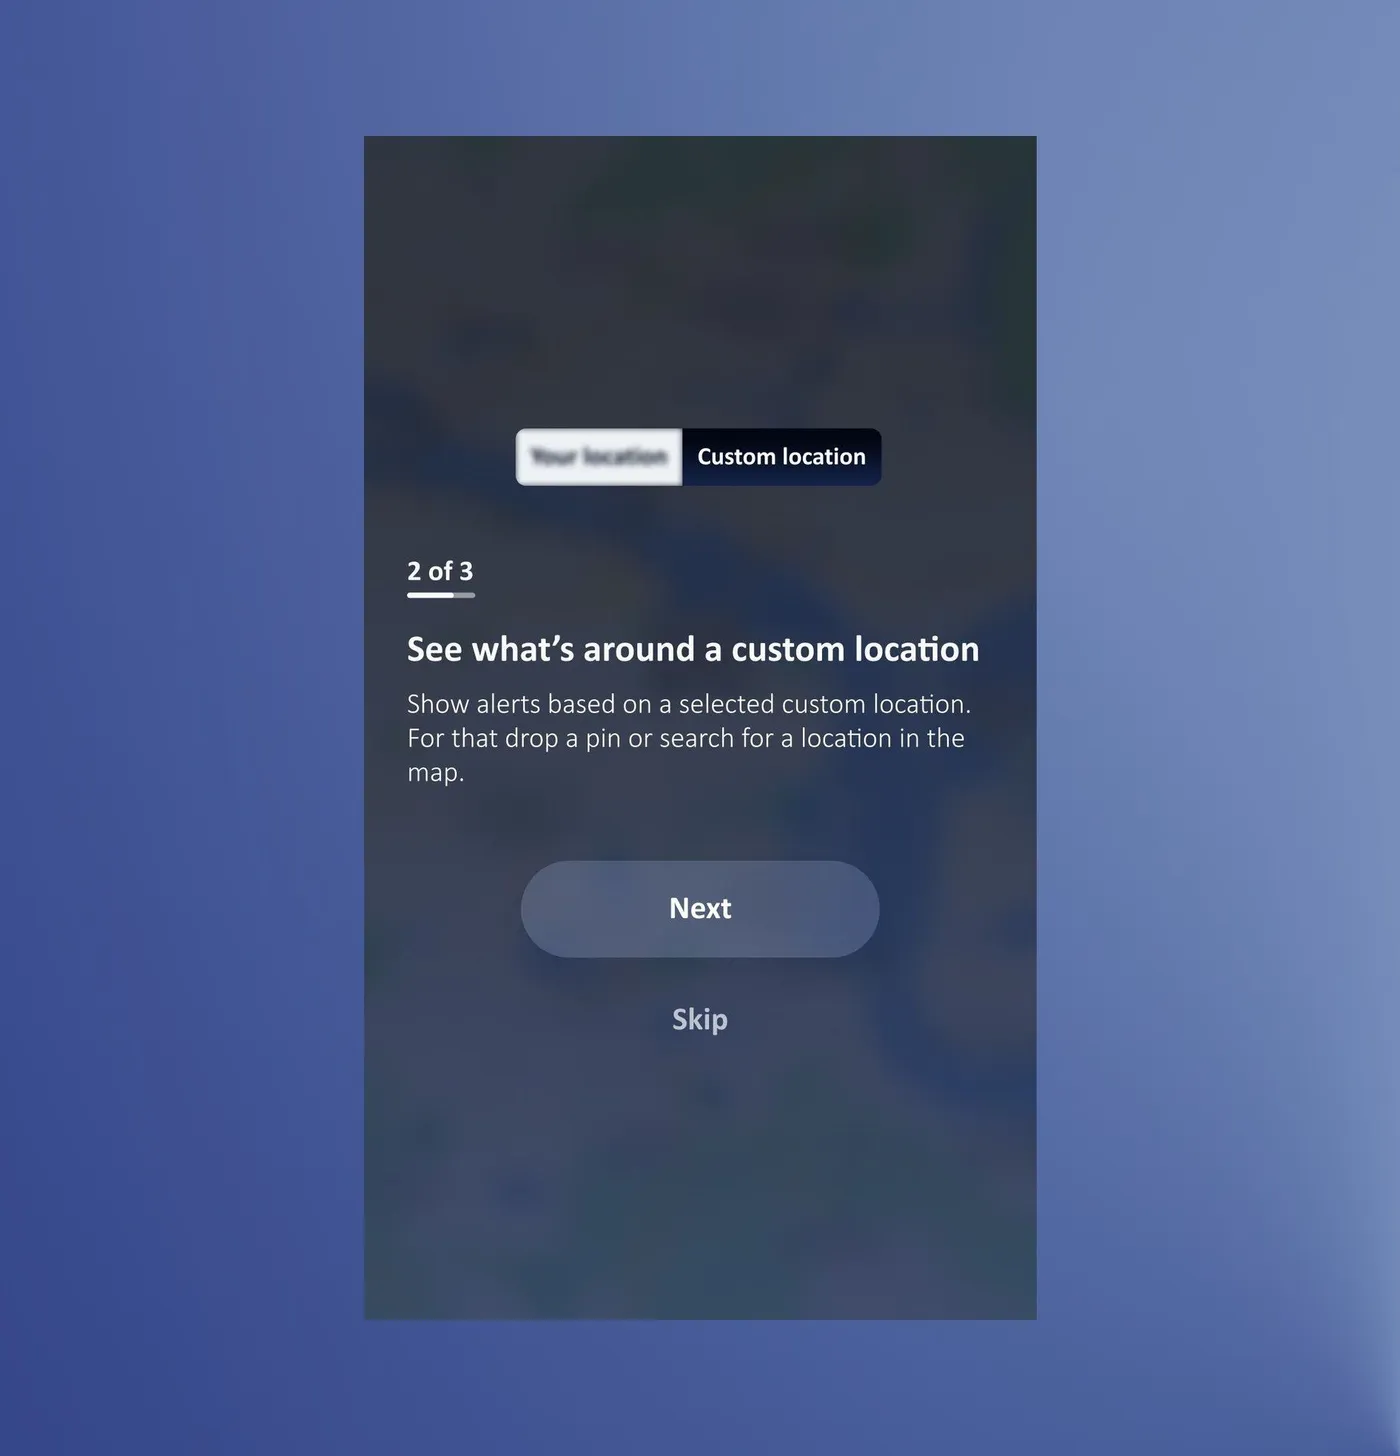
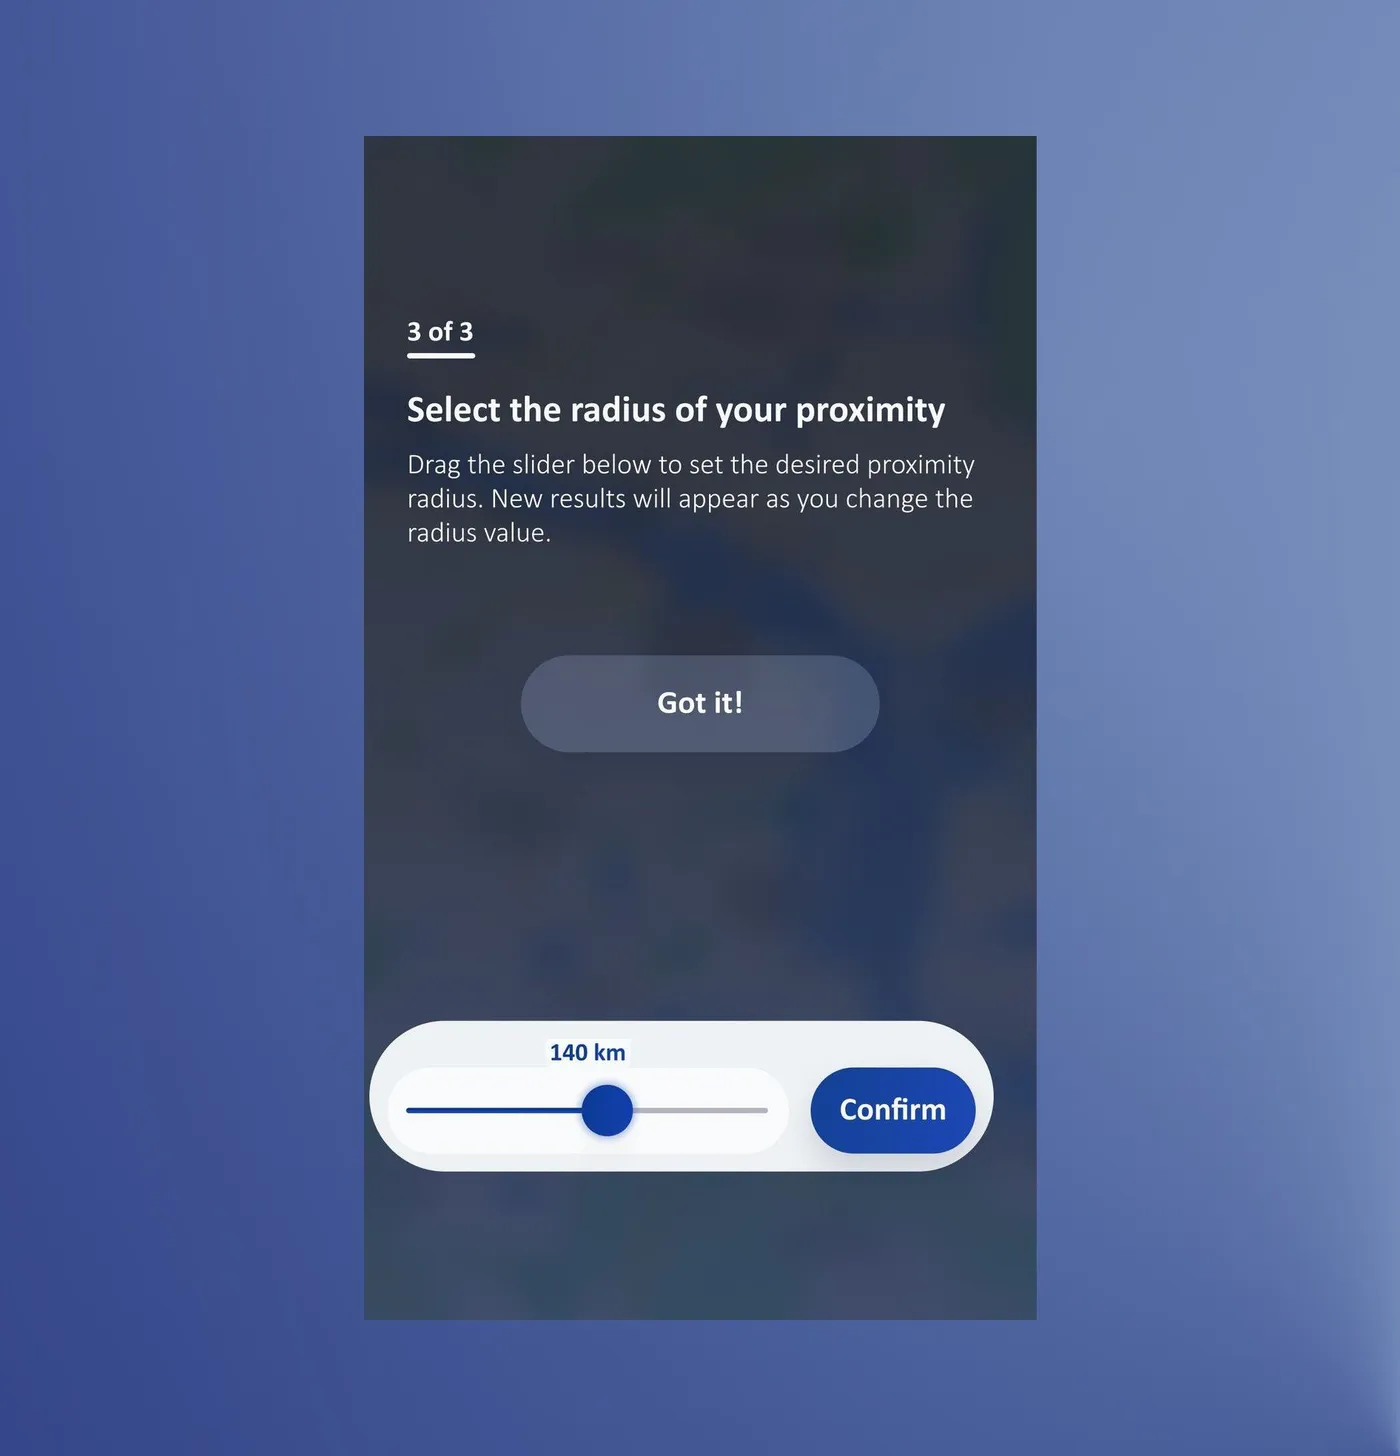
The tutorial cleared up the difference between live and custom location, and colleagues were more satisfied with the feature.
Interviews with 5 country office colleagues who hadn't seen the app before · updated design and prototype
Geofence: how do I track one specific area, like a residential campus?
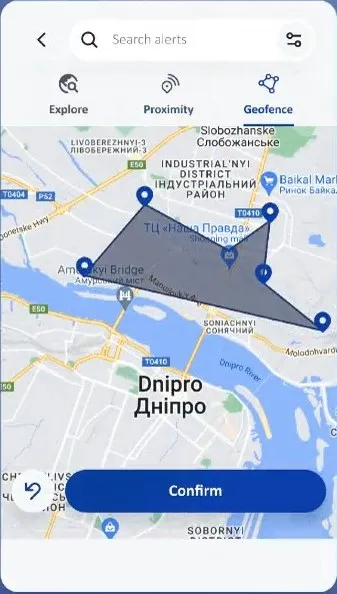
Let's take an organisation that wants to follow what happens around the compound where its staff live. They can draw a shape on the map to cover the exact area, and keep getting alerts from inside it.
Before
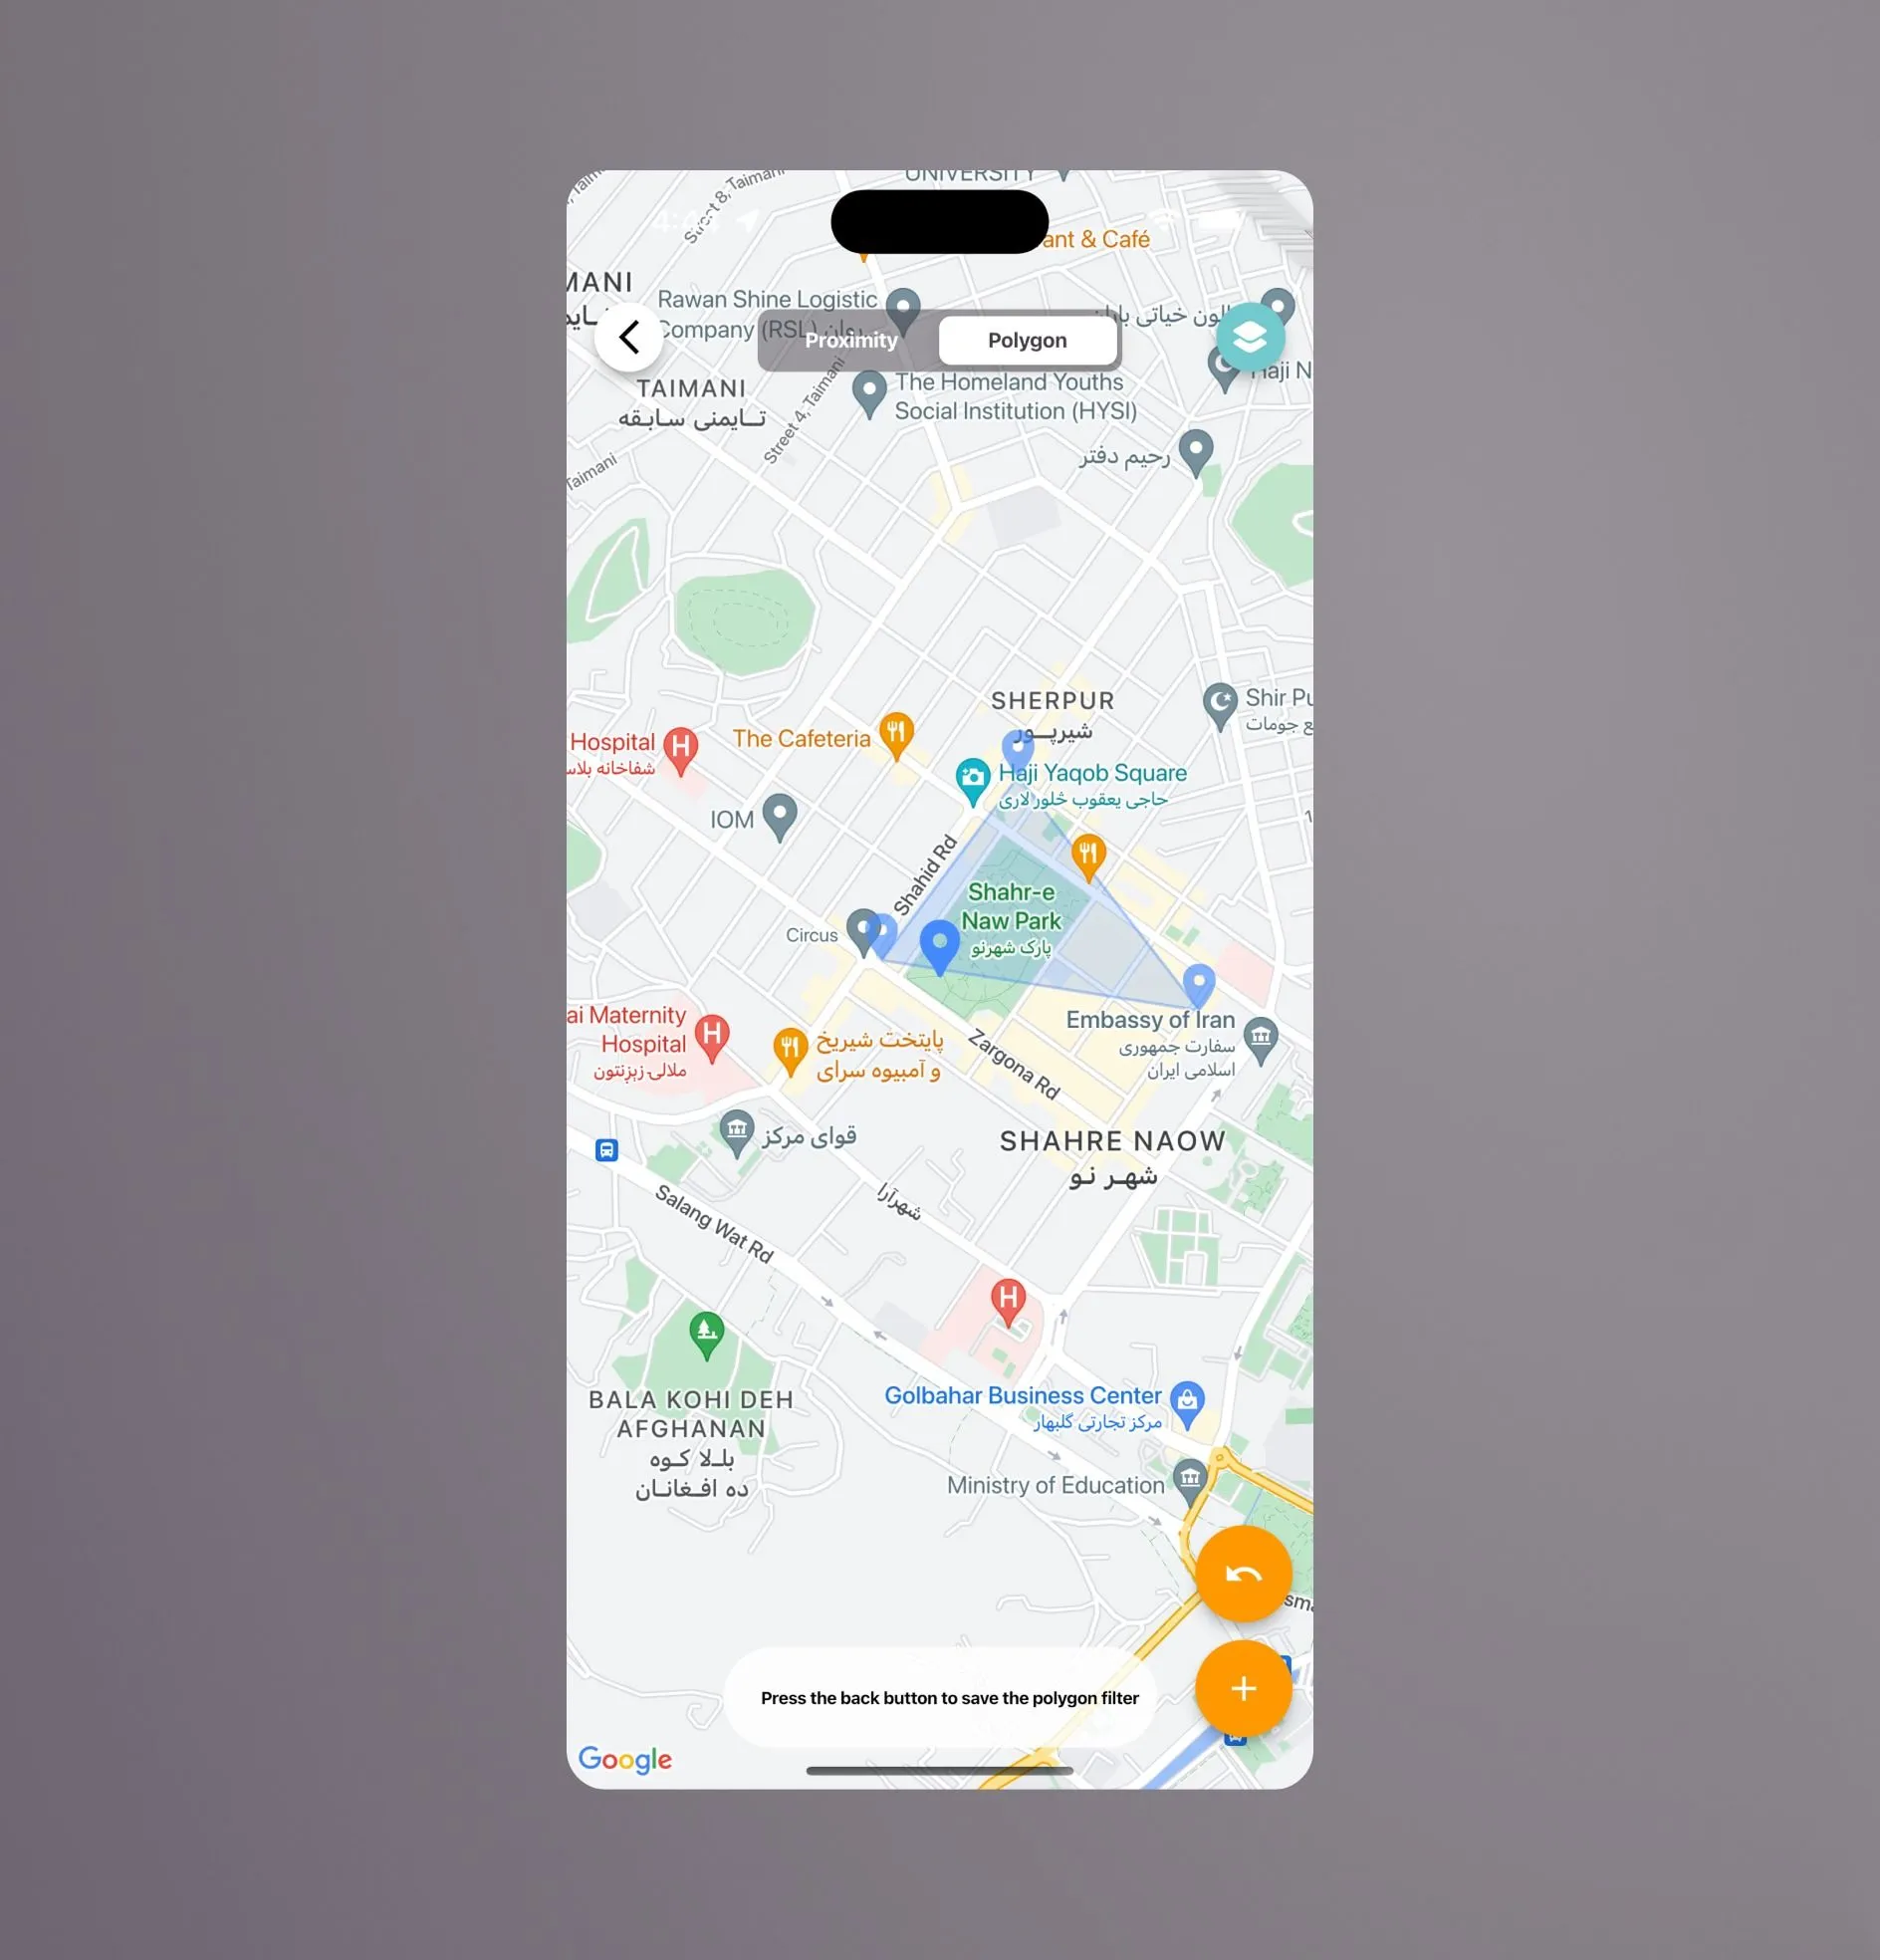
Polygon mode (Geofence)
| Geofence (Polygon) former design | Redesign approach (see slideshow below) |
|---|---|
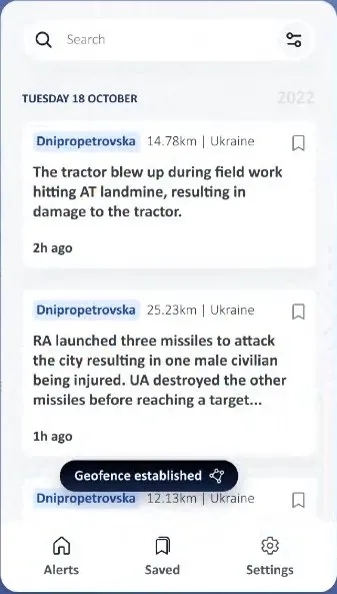
| 1Saving meant pressing the Back button ("Press the back button to save the polygon filter"). It was hidden and backwards, since Back normally cancels. | An explicit Confirm button, and a "Geofence established" message afterwards |
| 2No instructions. The first screen was just a map, with no hint to tap to drop pins, or that zooming first matters. | A three-step tutorial: zoom, drop pins, confirm |
| 3No result feedback. You drew a shape but couldn't tell how many alerts it contained. | "76 alerts in the selected area", with the alert markers inside the shape |
| 4Two unlabelled orange buttons (an undo arrow and a "+"). Their purpose wasn't clear, and orange didn't match the rest of the app. | An undo button, plus labelled "Clear all" and "Edit geofence" buttons |
| 5The name "Polygon" is a geometry term, not a task. | Renamed Geofence, one of three clear tabs: Explore, Proximity, Geofence |
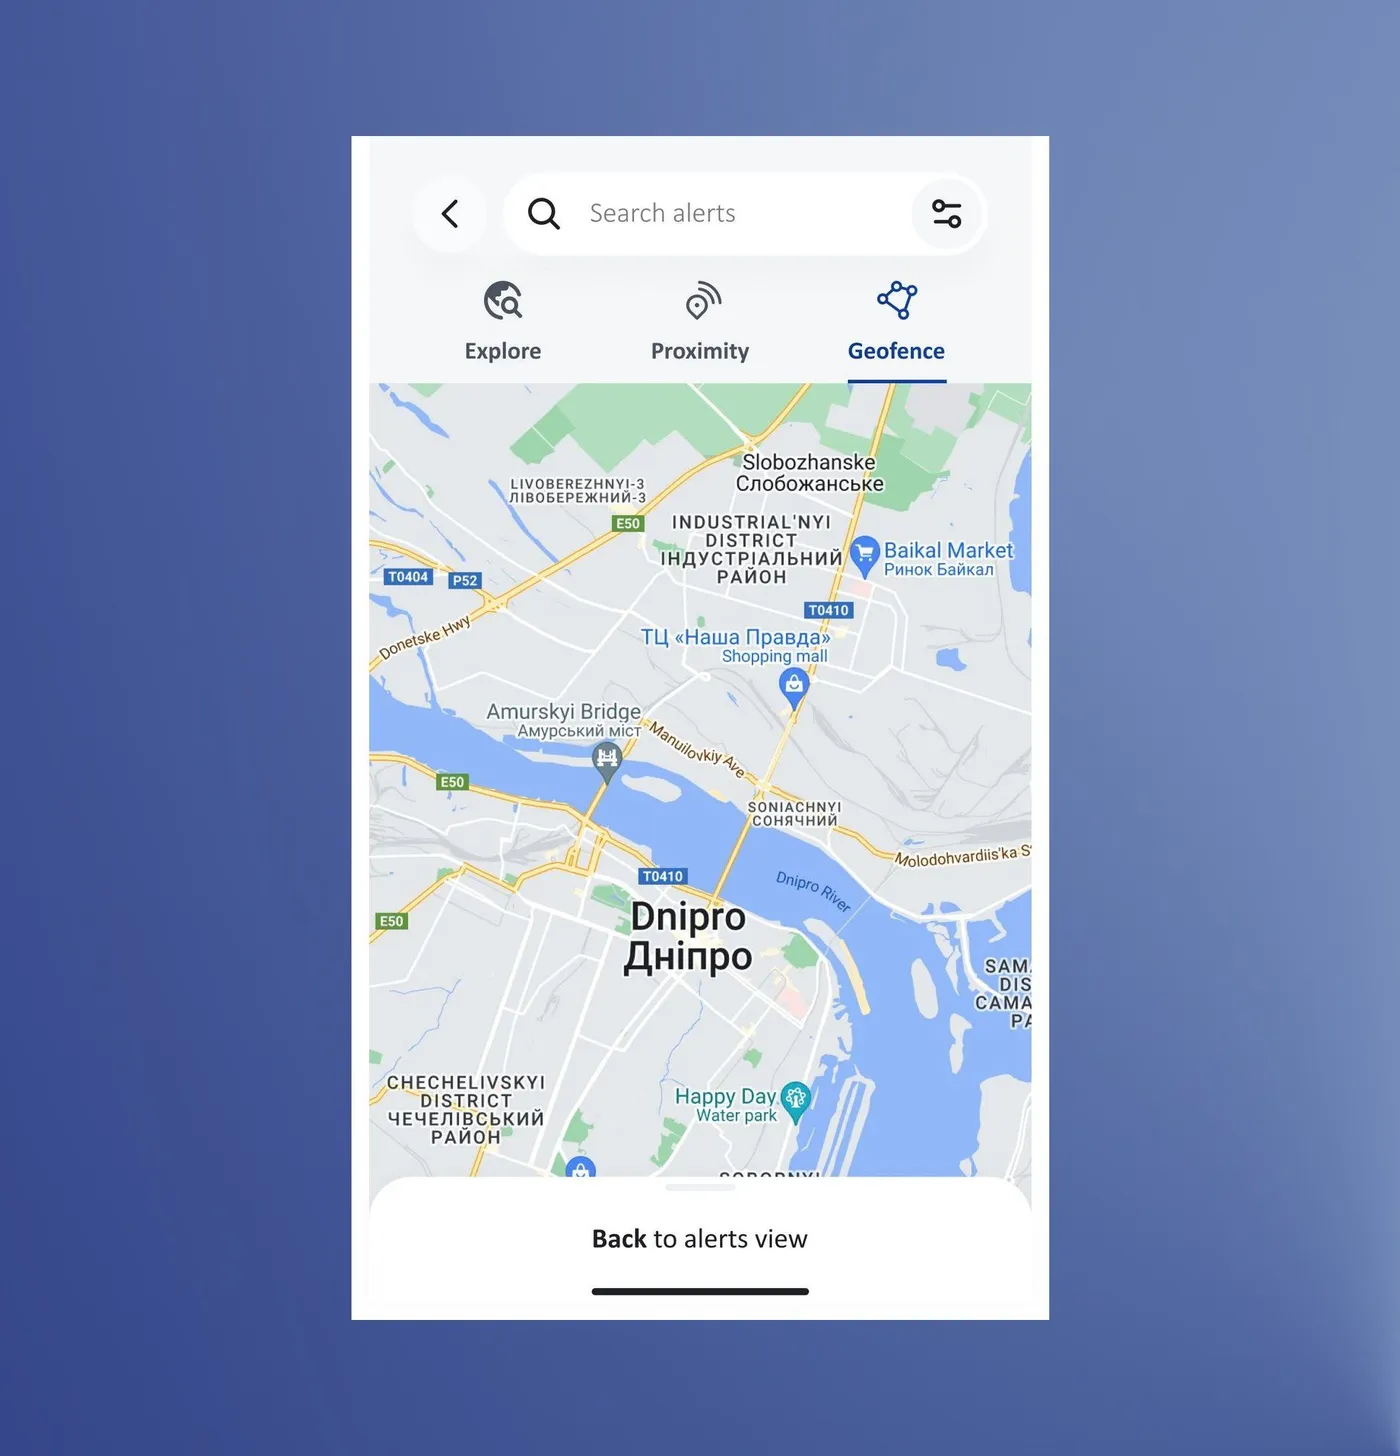
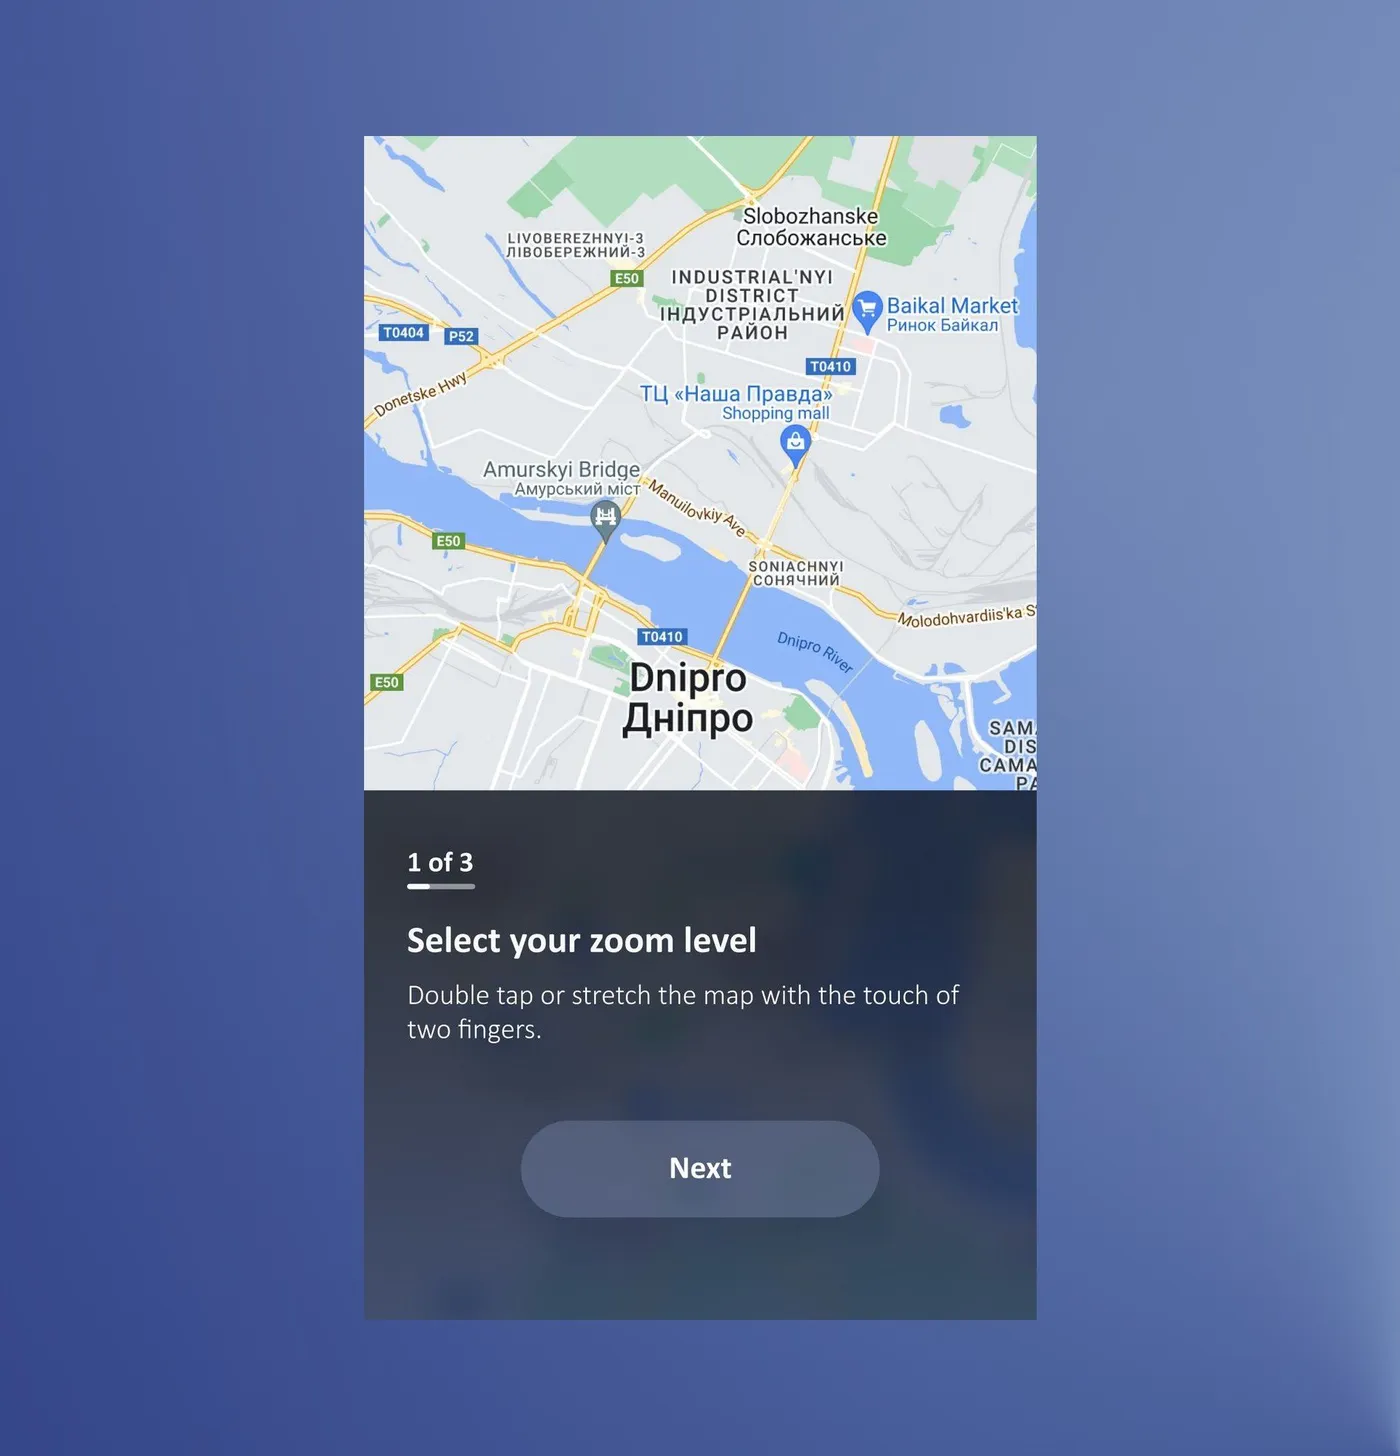
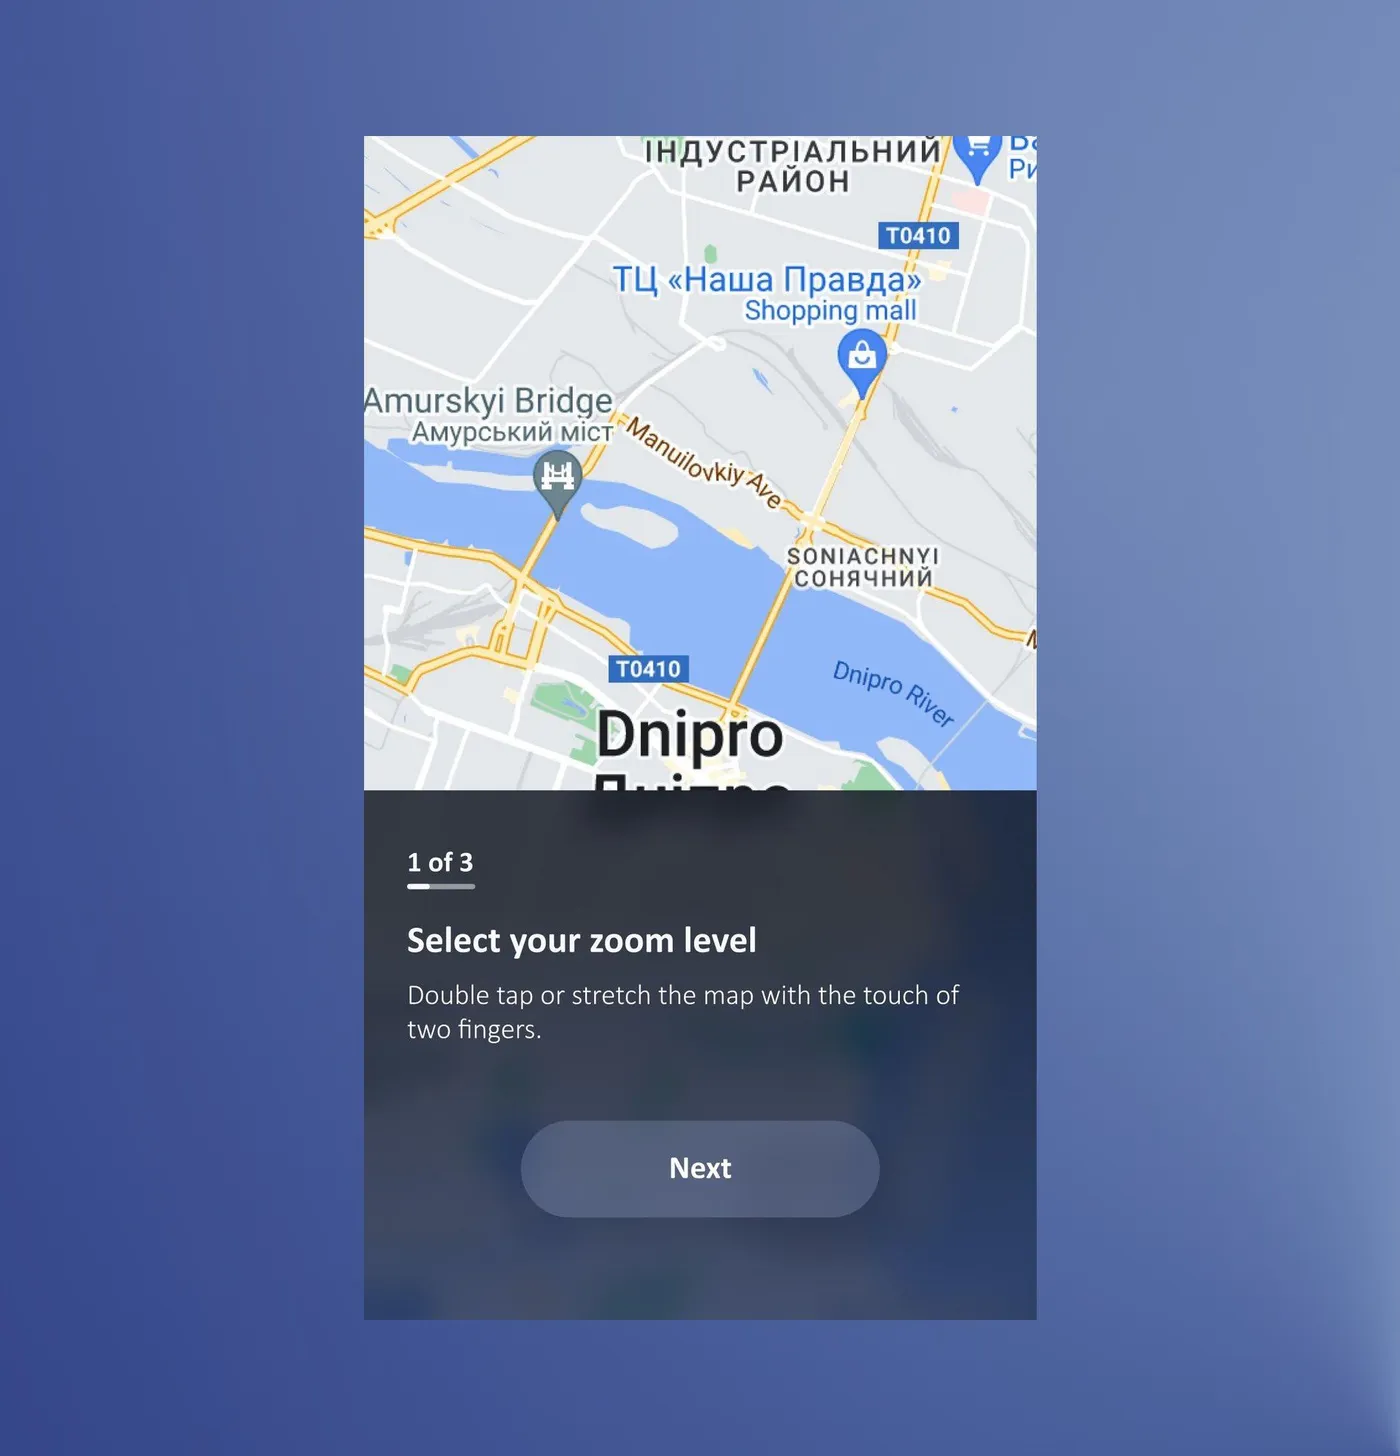
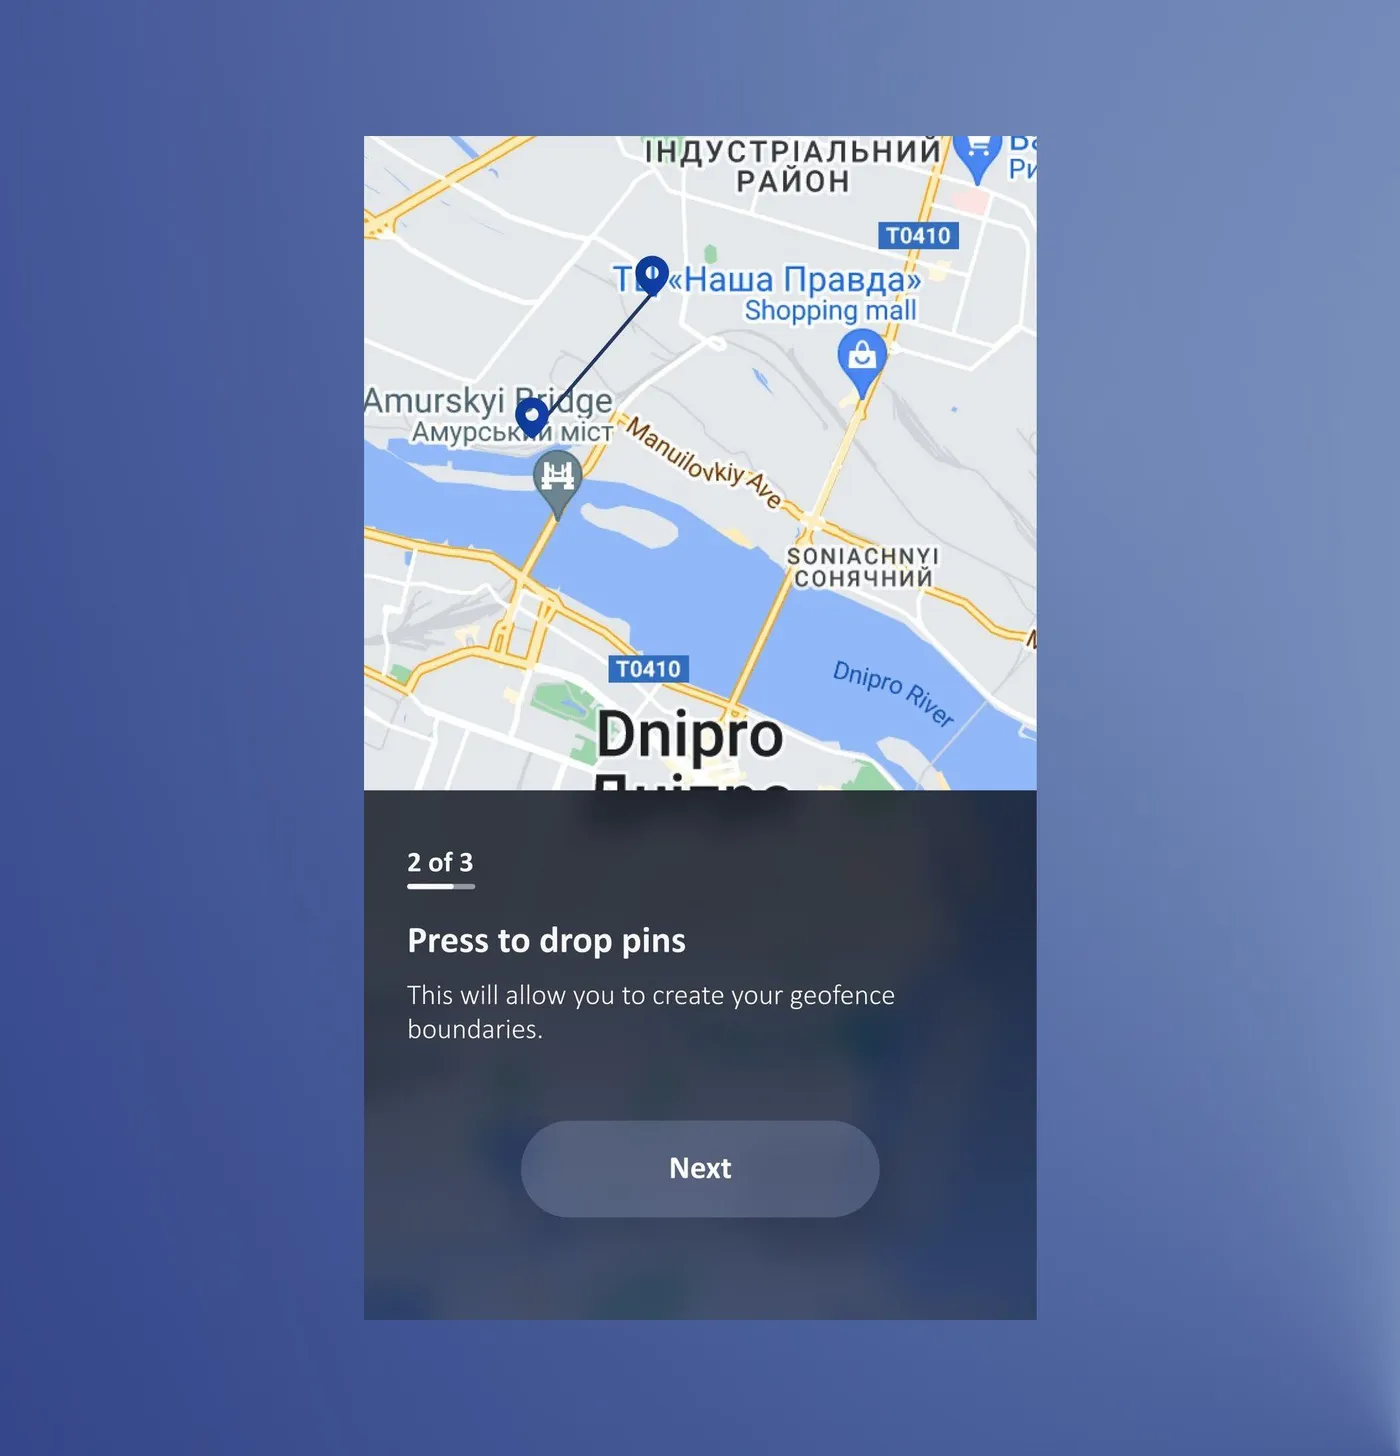
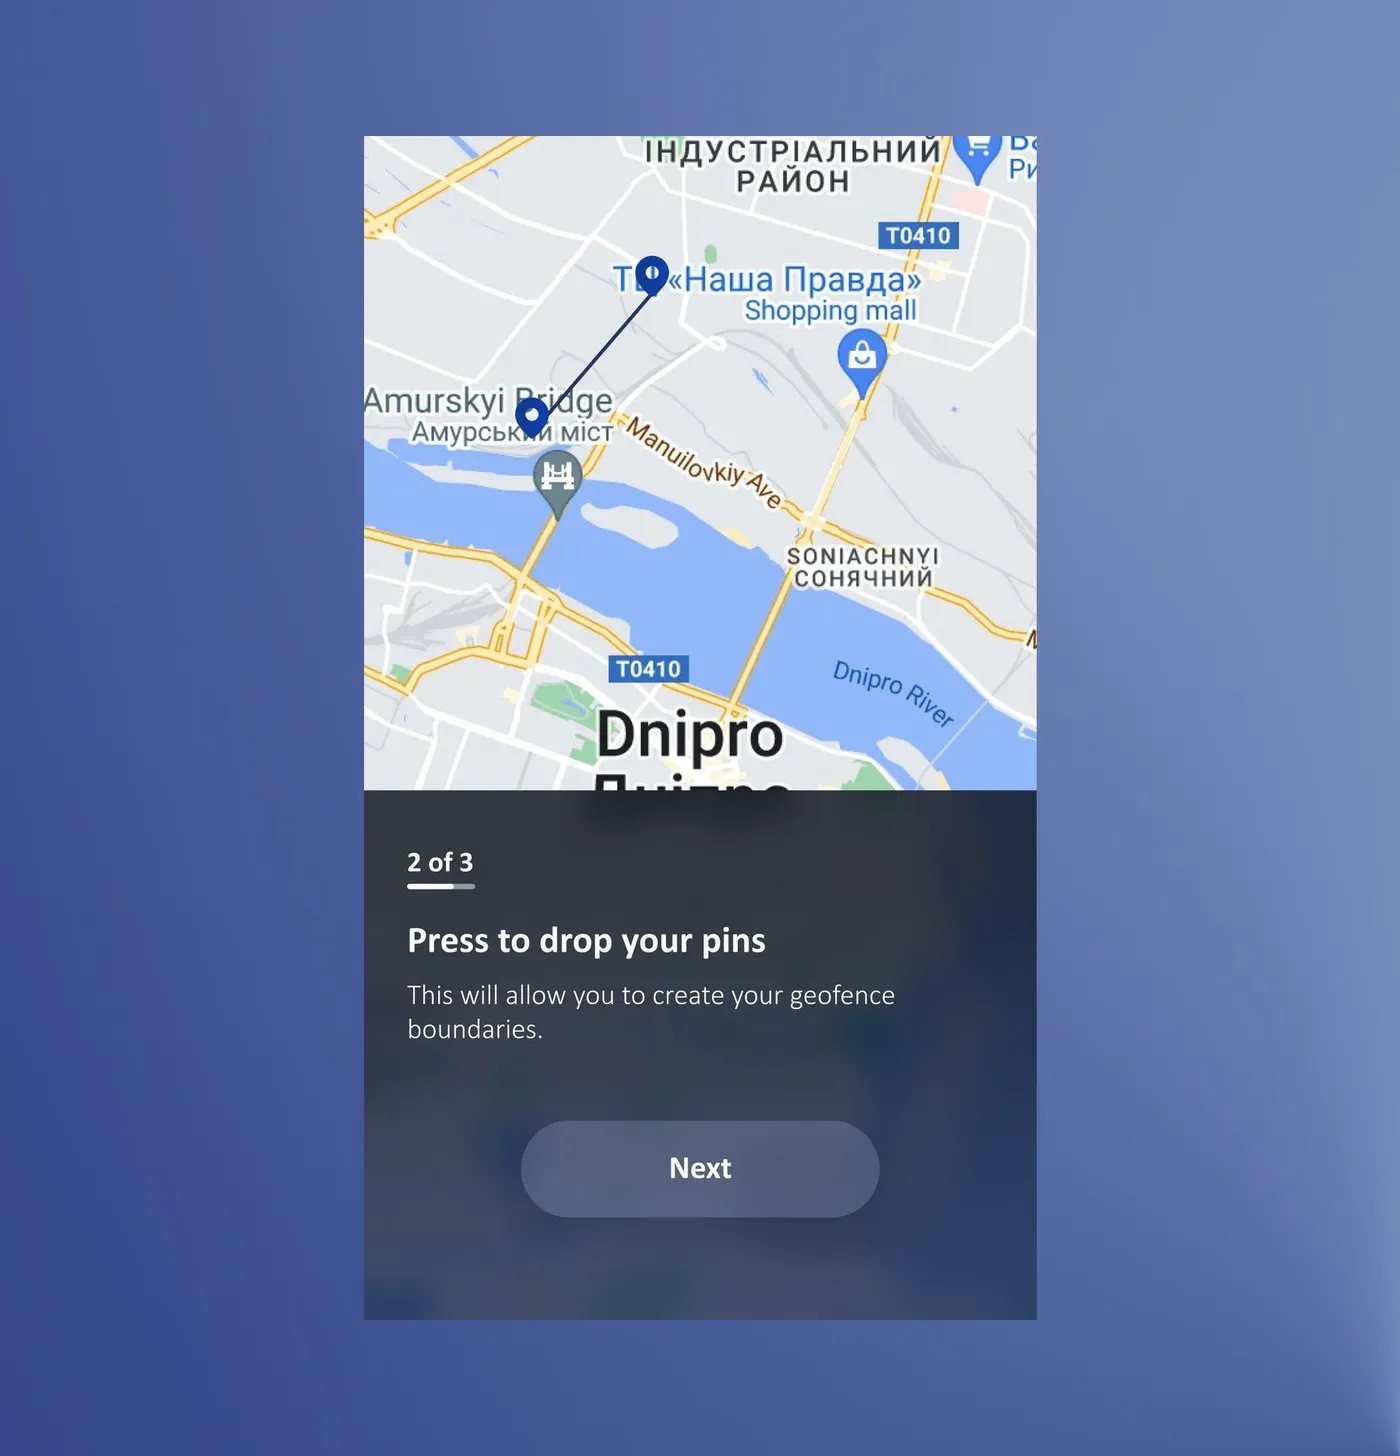
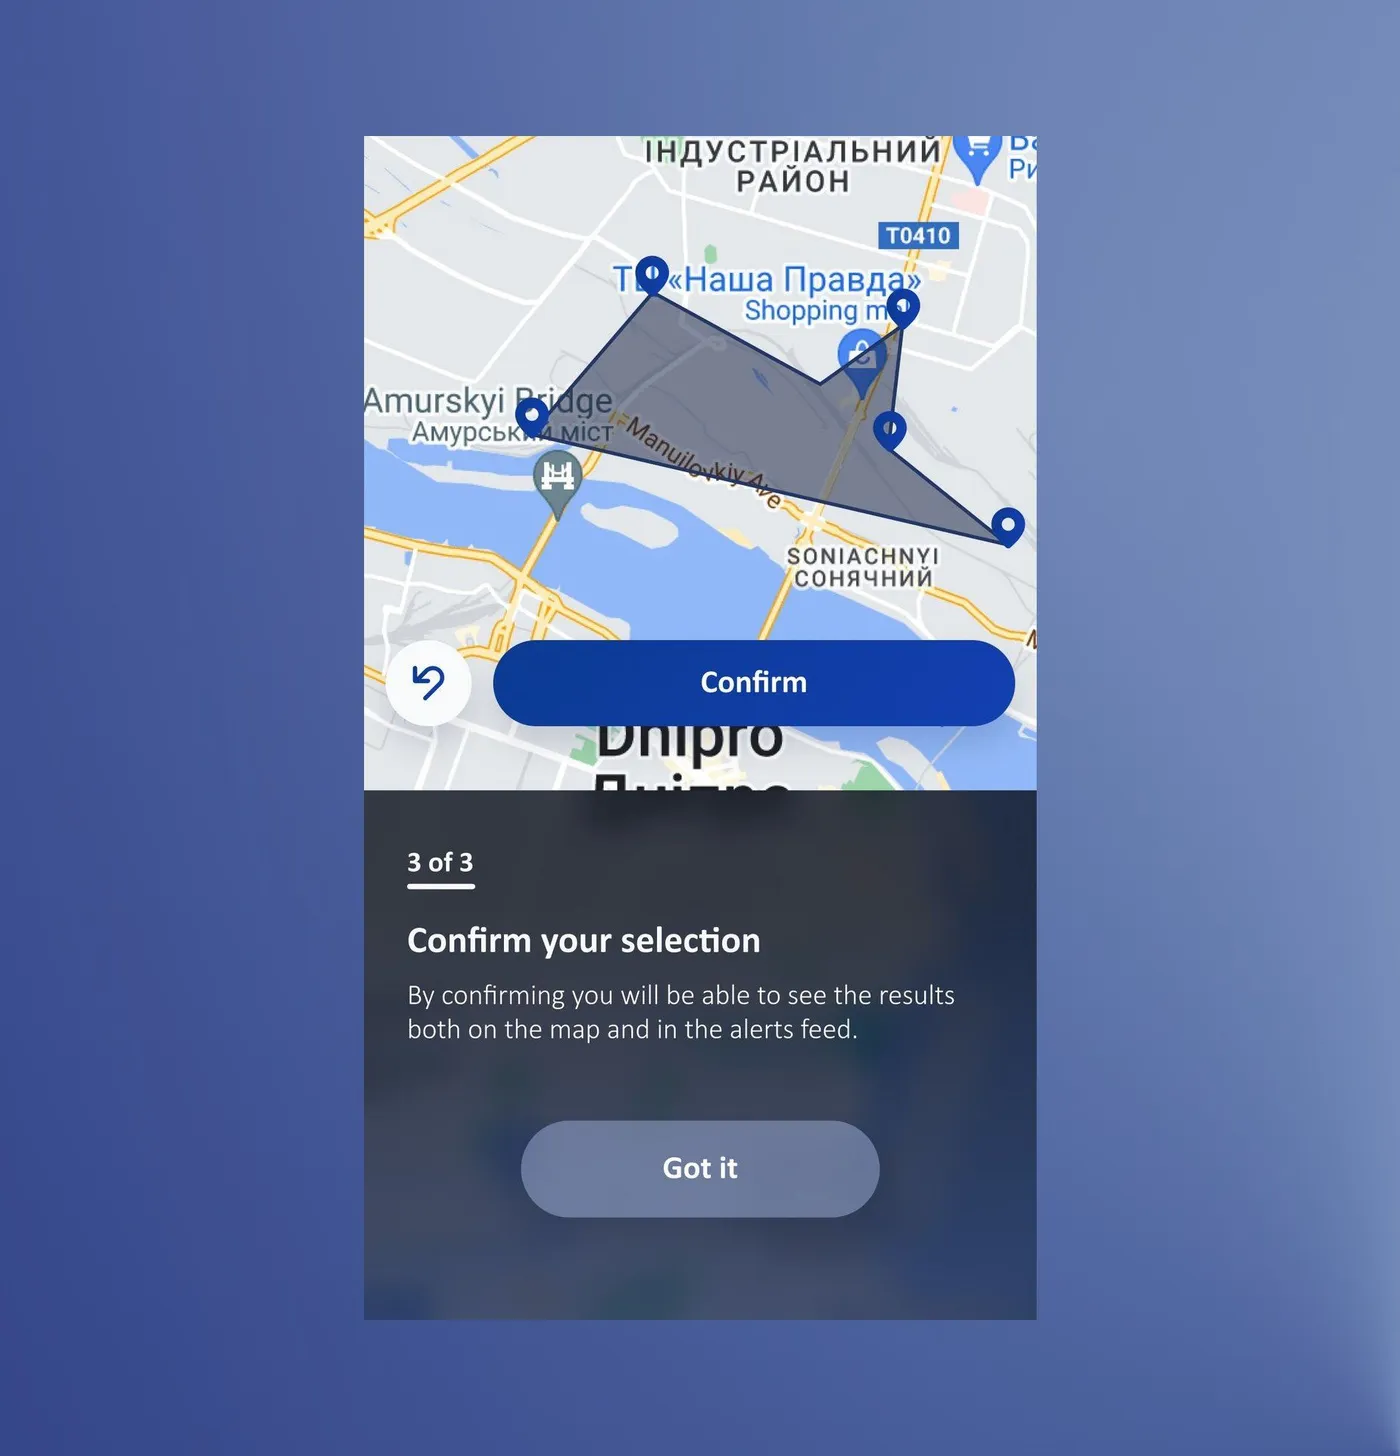
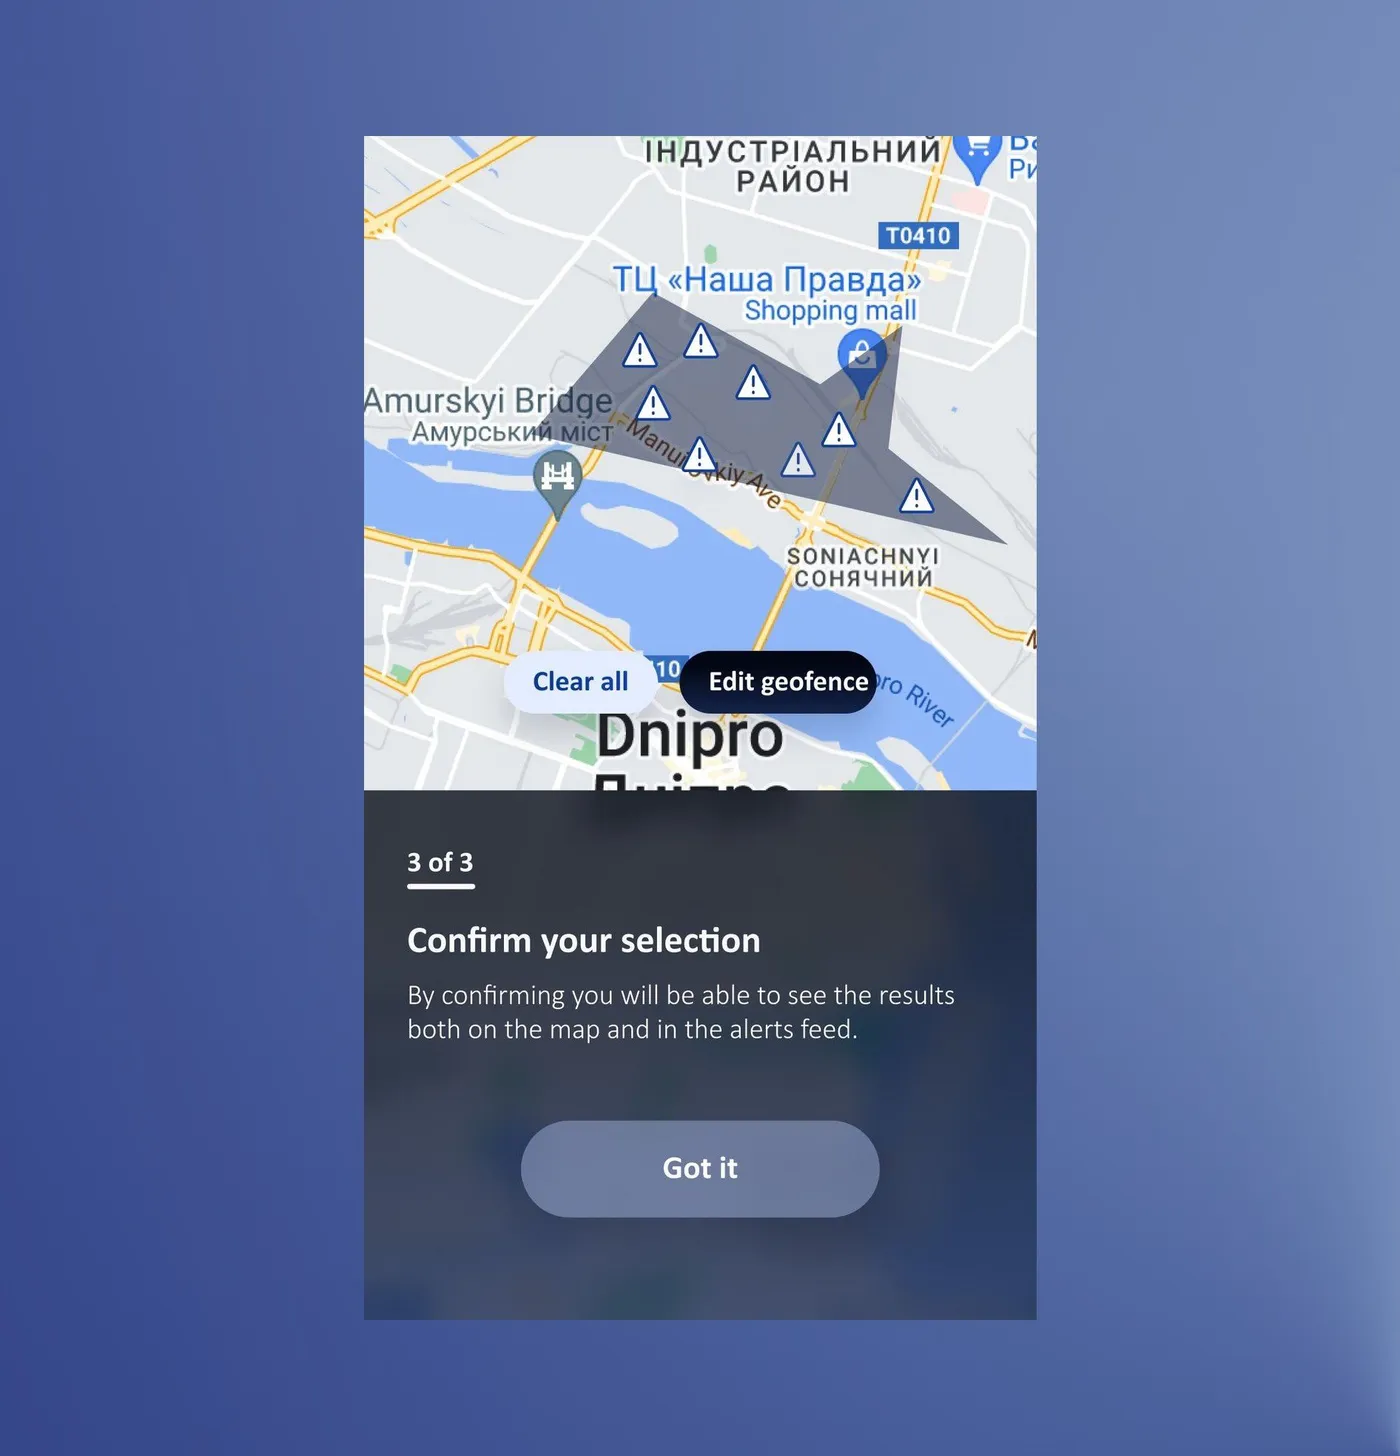
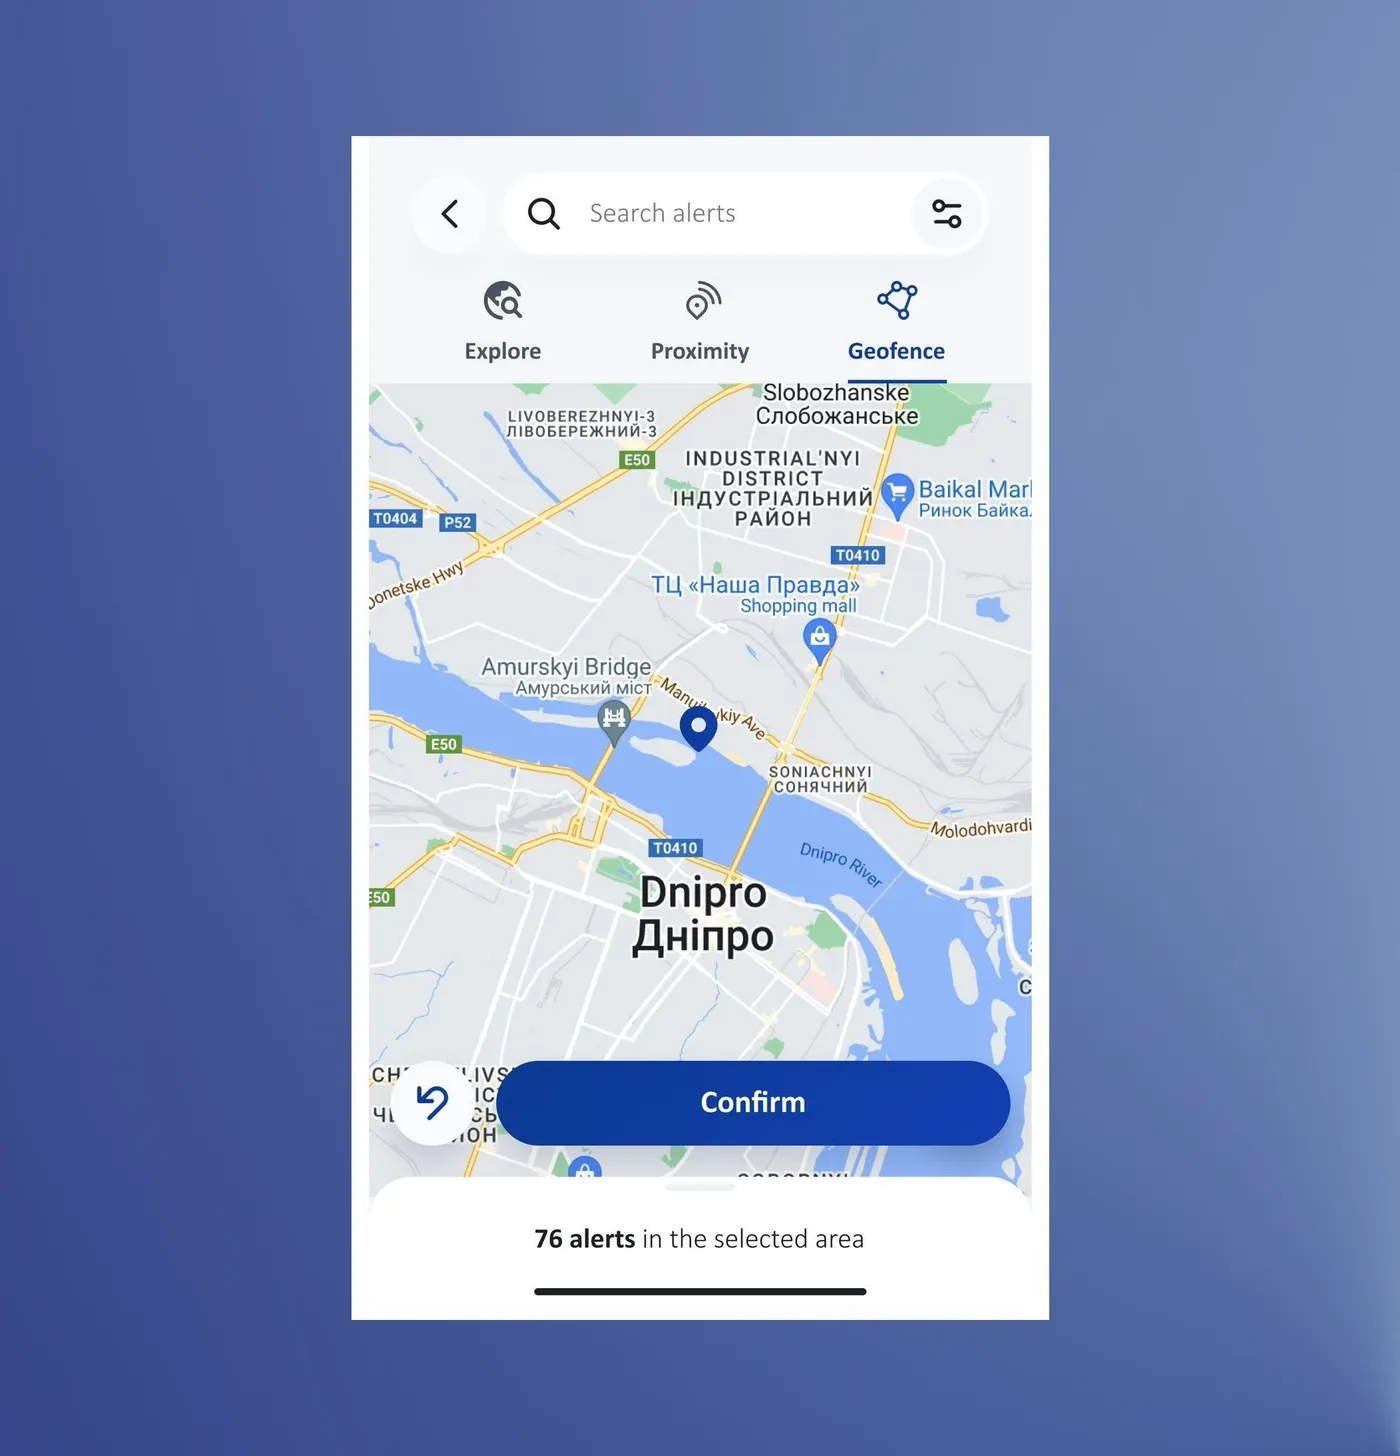
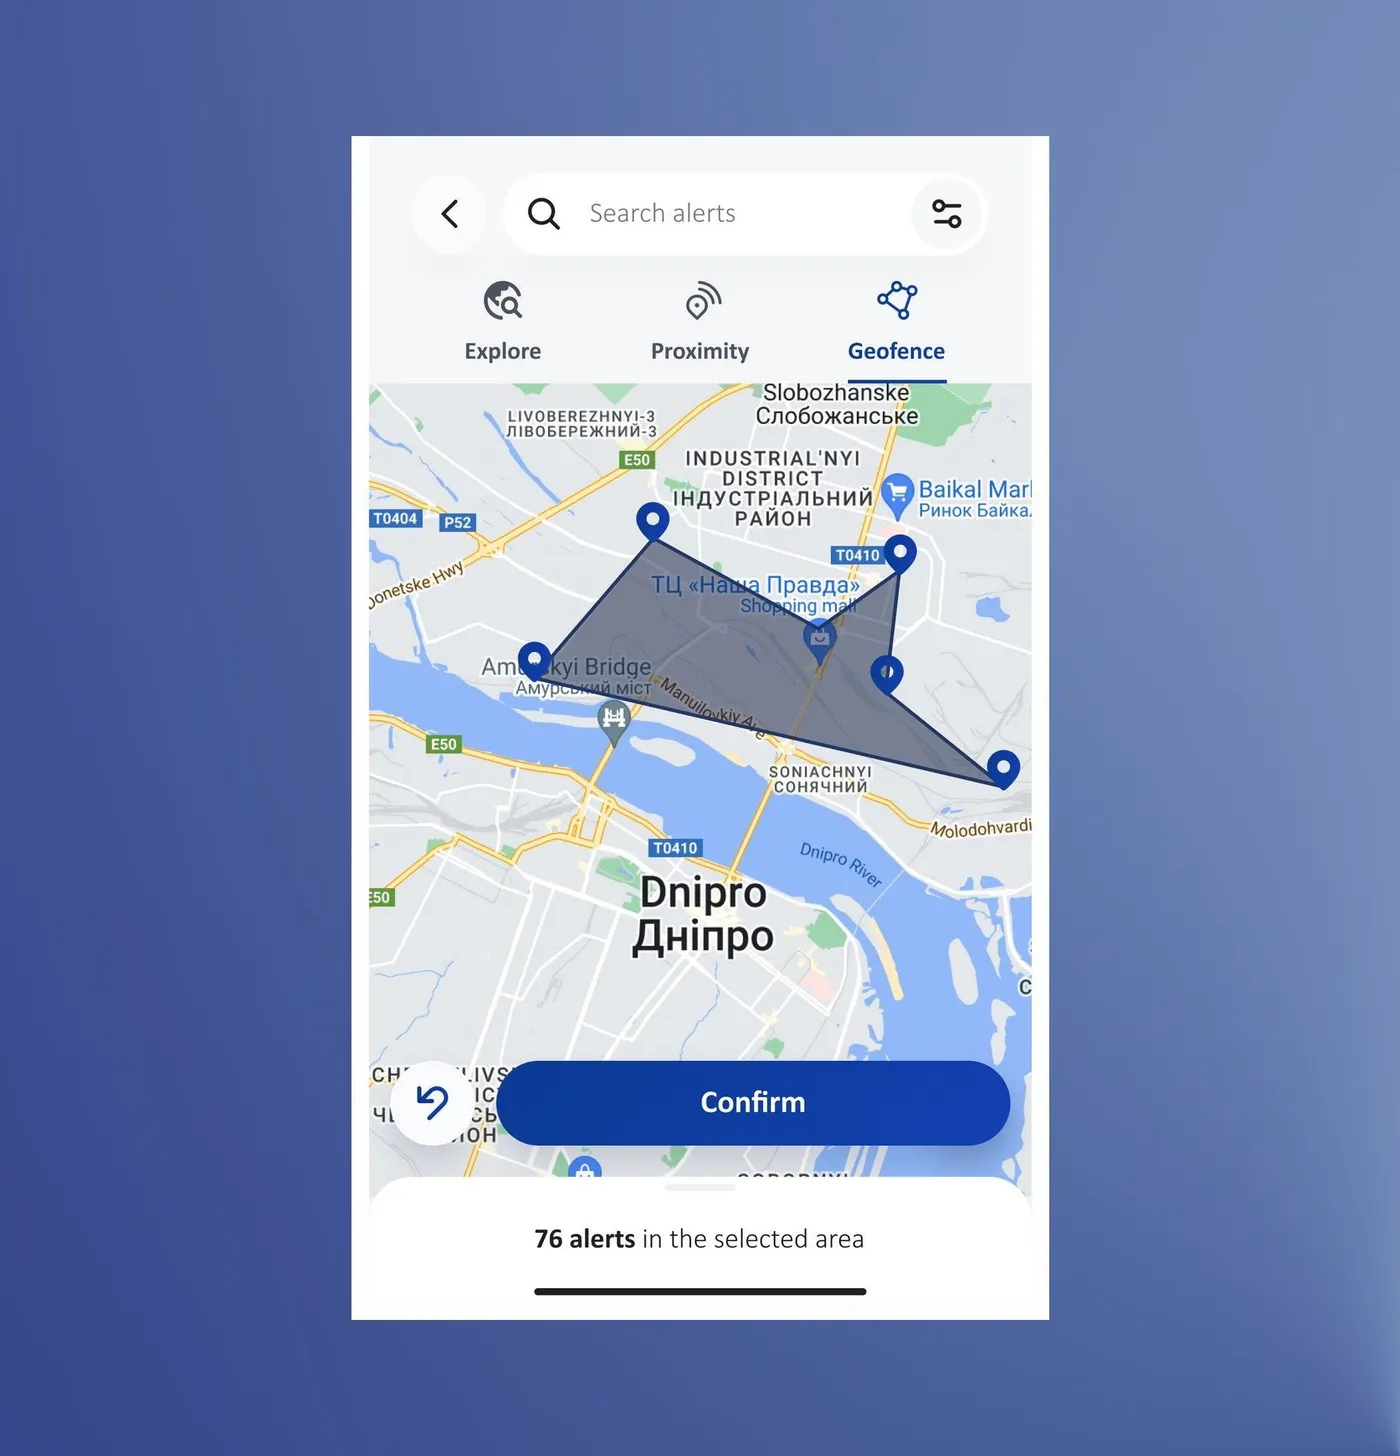
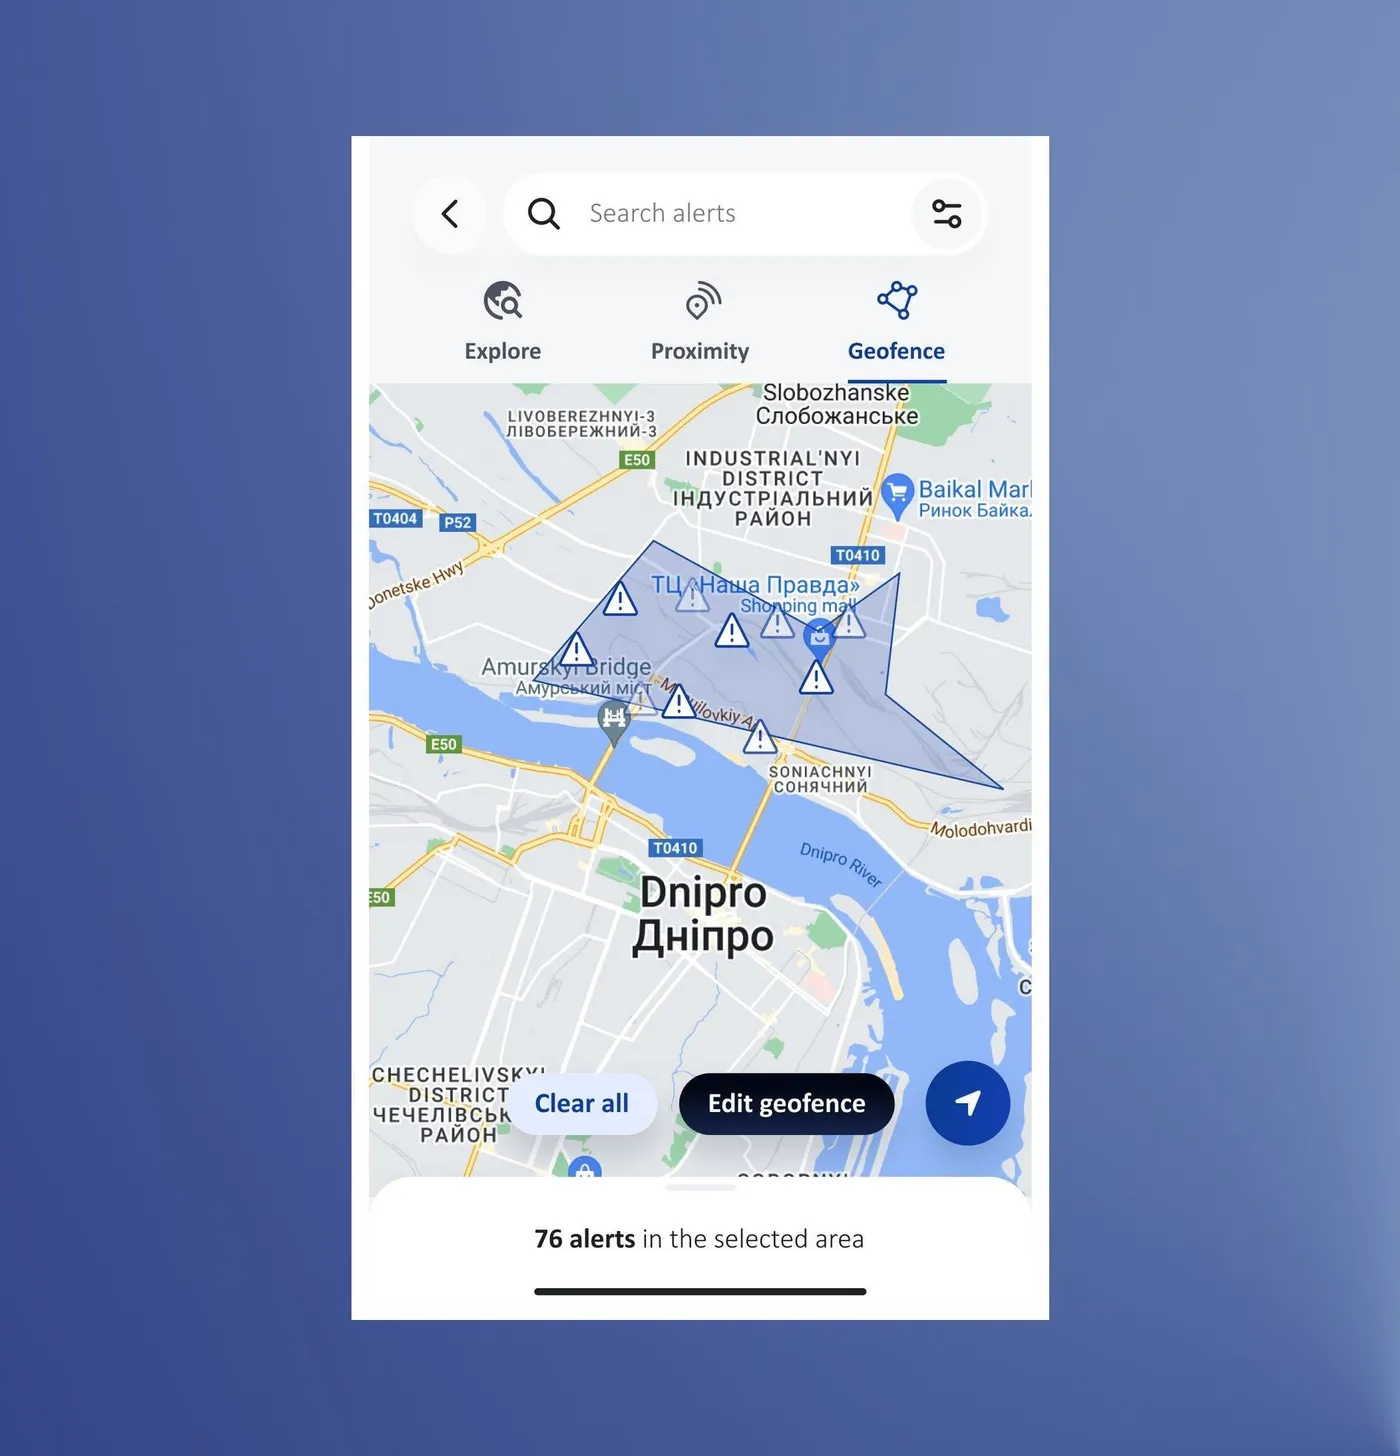
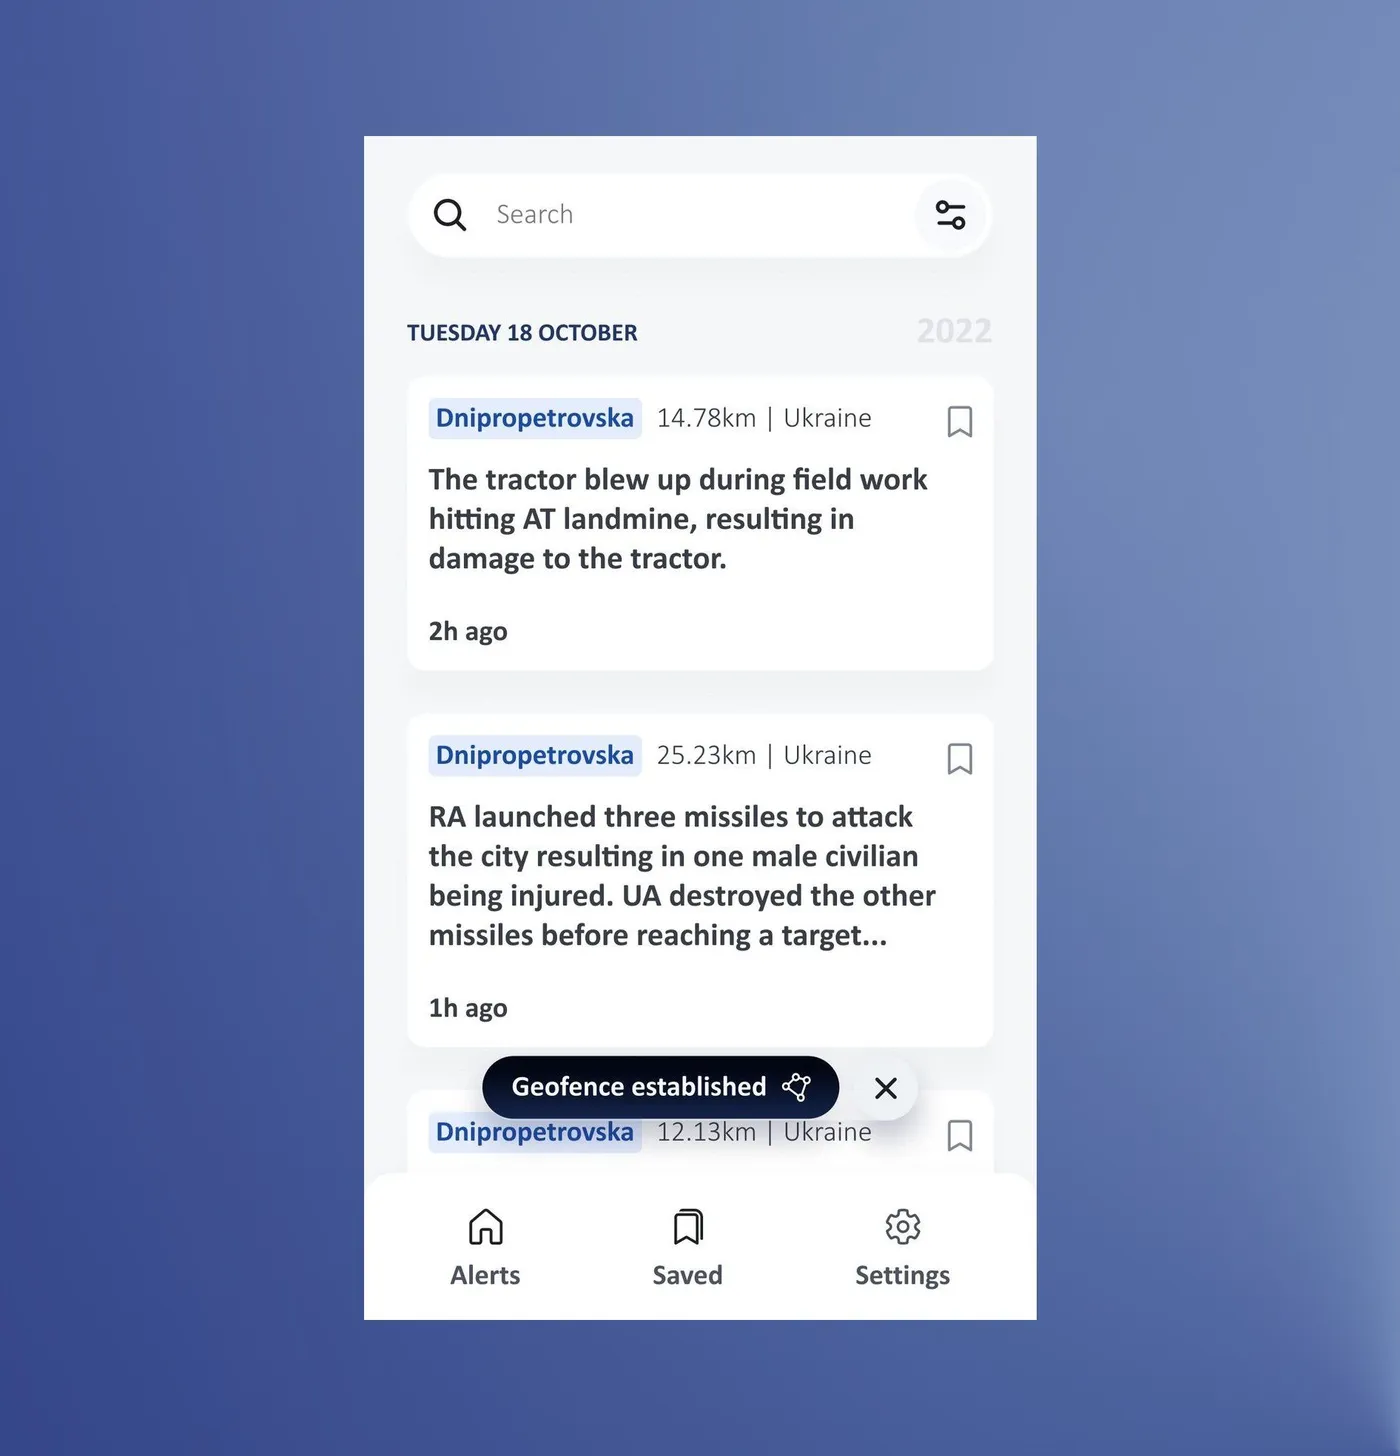
It was also the hardest to learn: 5 of 8 testers finished the task but none of them took the intended path. Two asked for a video, which is heavy on weak connections, so Geofence got the same kind of three-step animated tutorial instead.
Colleagues understood Geofence, but saw it as relevant only to those who work actively with maps.
From the same 5 interviews; the lowest-ranked feature in the post-launch partner survey (9 of 30), as expected for a specialist tool
What people actually use
Across releases, Explore takes most of the map traffic, with Proximity and Geofence well behind. That matches what partners ranked as most important, and it fits Geofence being a tool for a handful of specialists.
After the first release
The project didn't stop here, since continuous feedback from country office colleagues kept shaping the app after launch:
- Notifications limited to your regions or to a saved map search, after a short survey with country office staff. People do open them: over 100,000 times from notifications in three years.
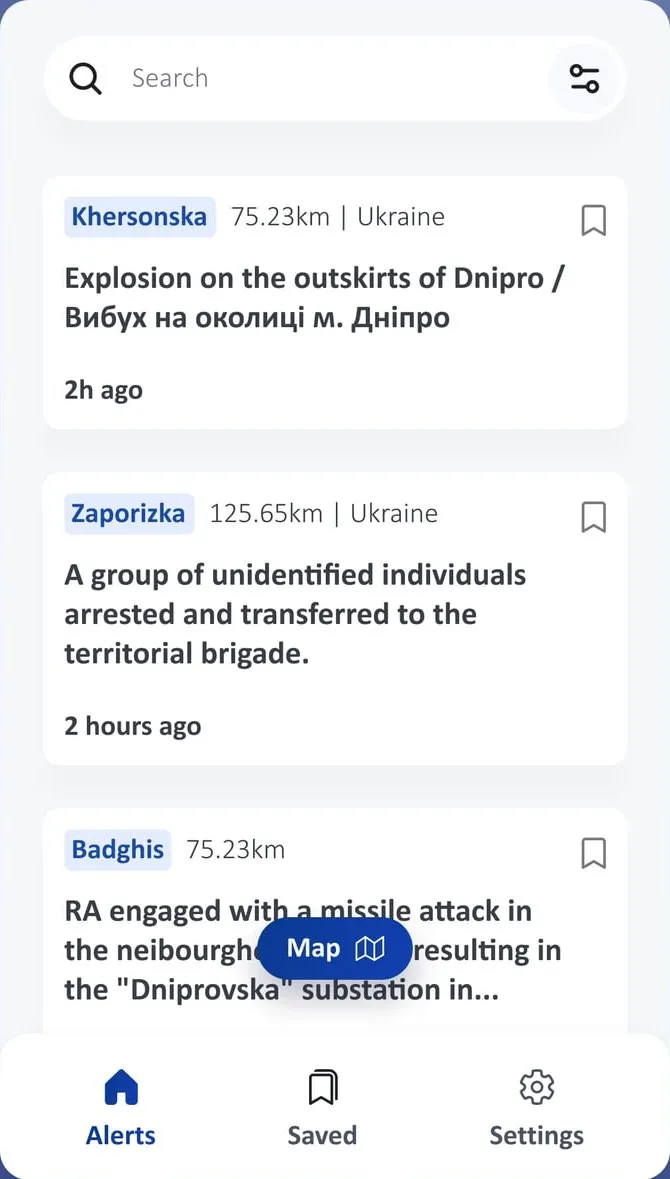
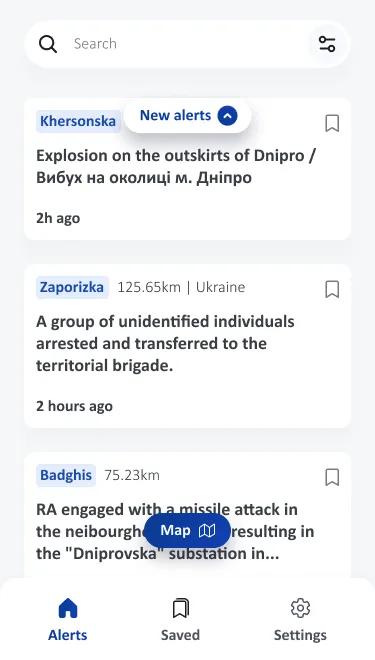
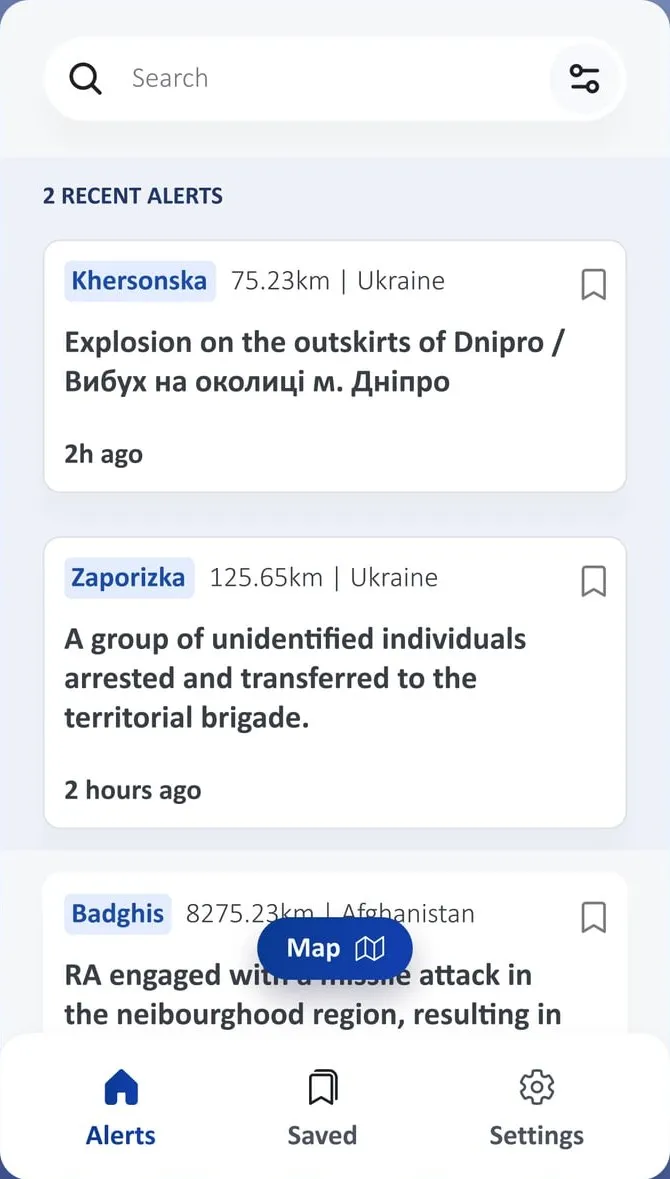
- Unseen alerts pointed out, a new Recent Alerts block, and a restyled date picker with quick options (last 3 days, last week, last month) that shows clearly when a filter is on.
- Animated tutorials in every map mode.
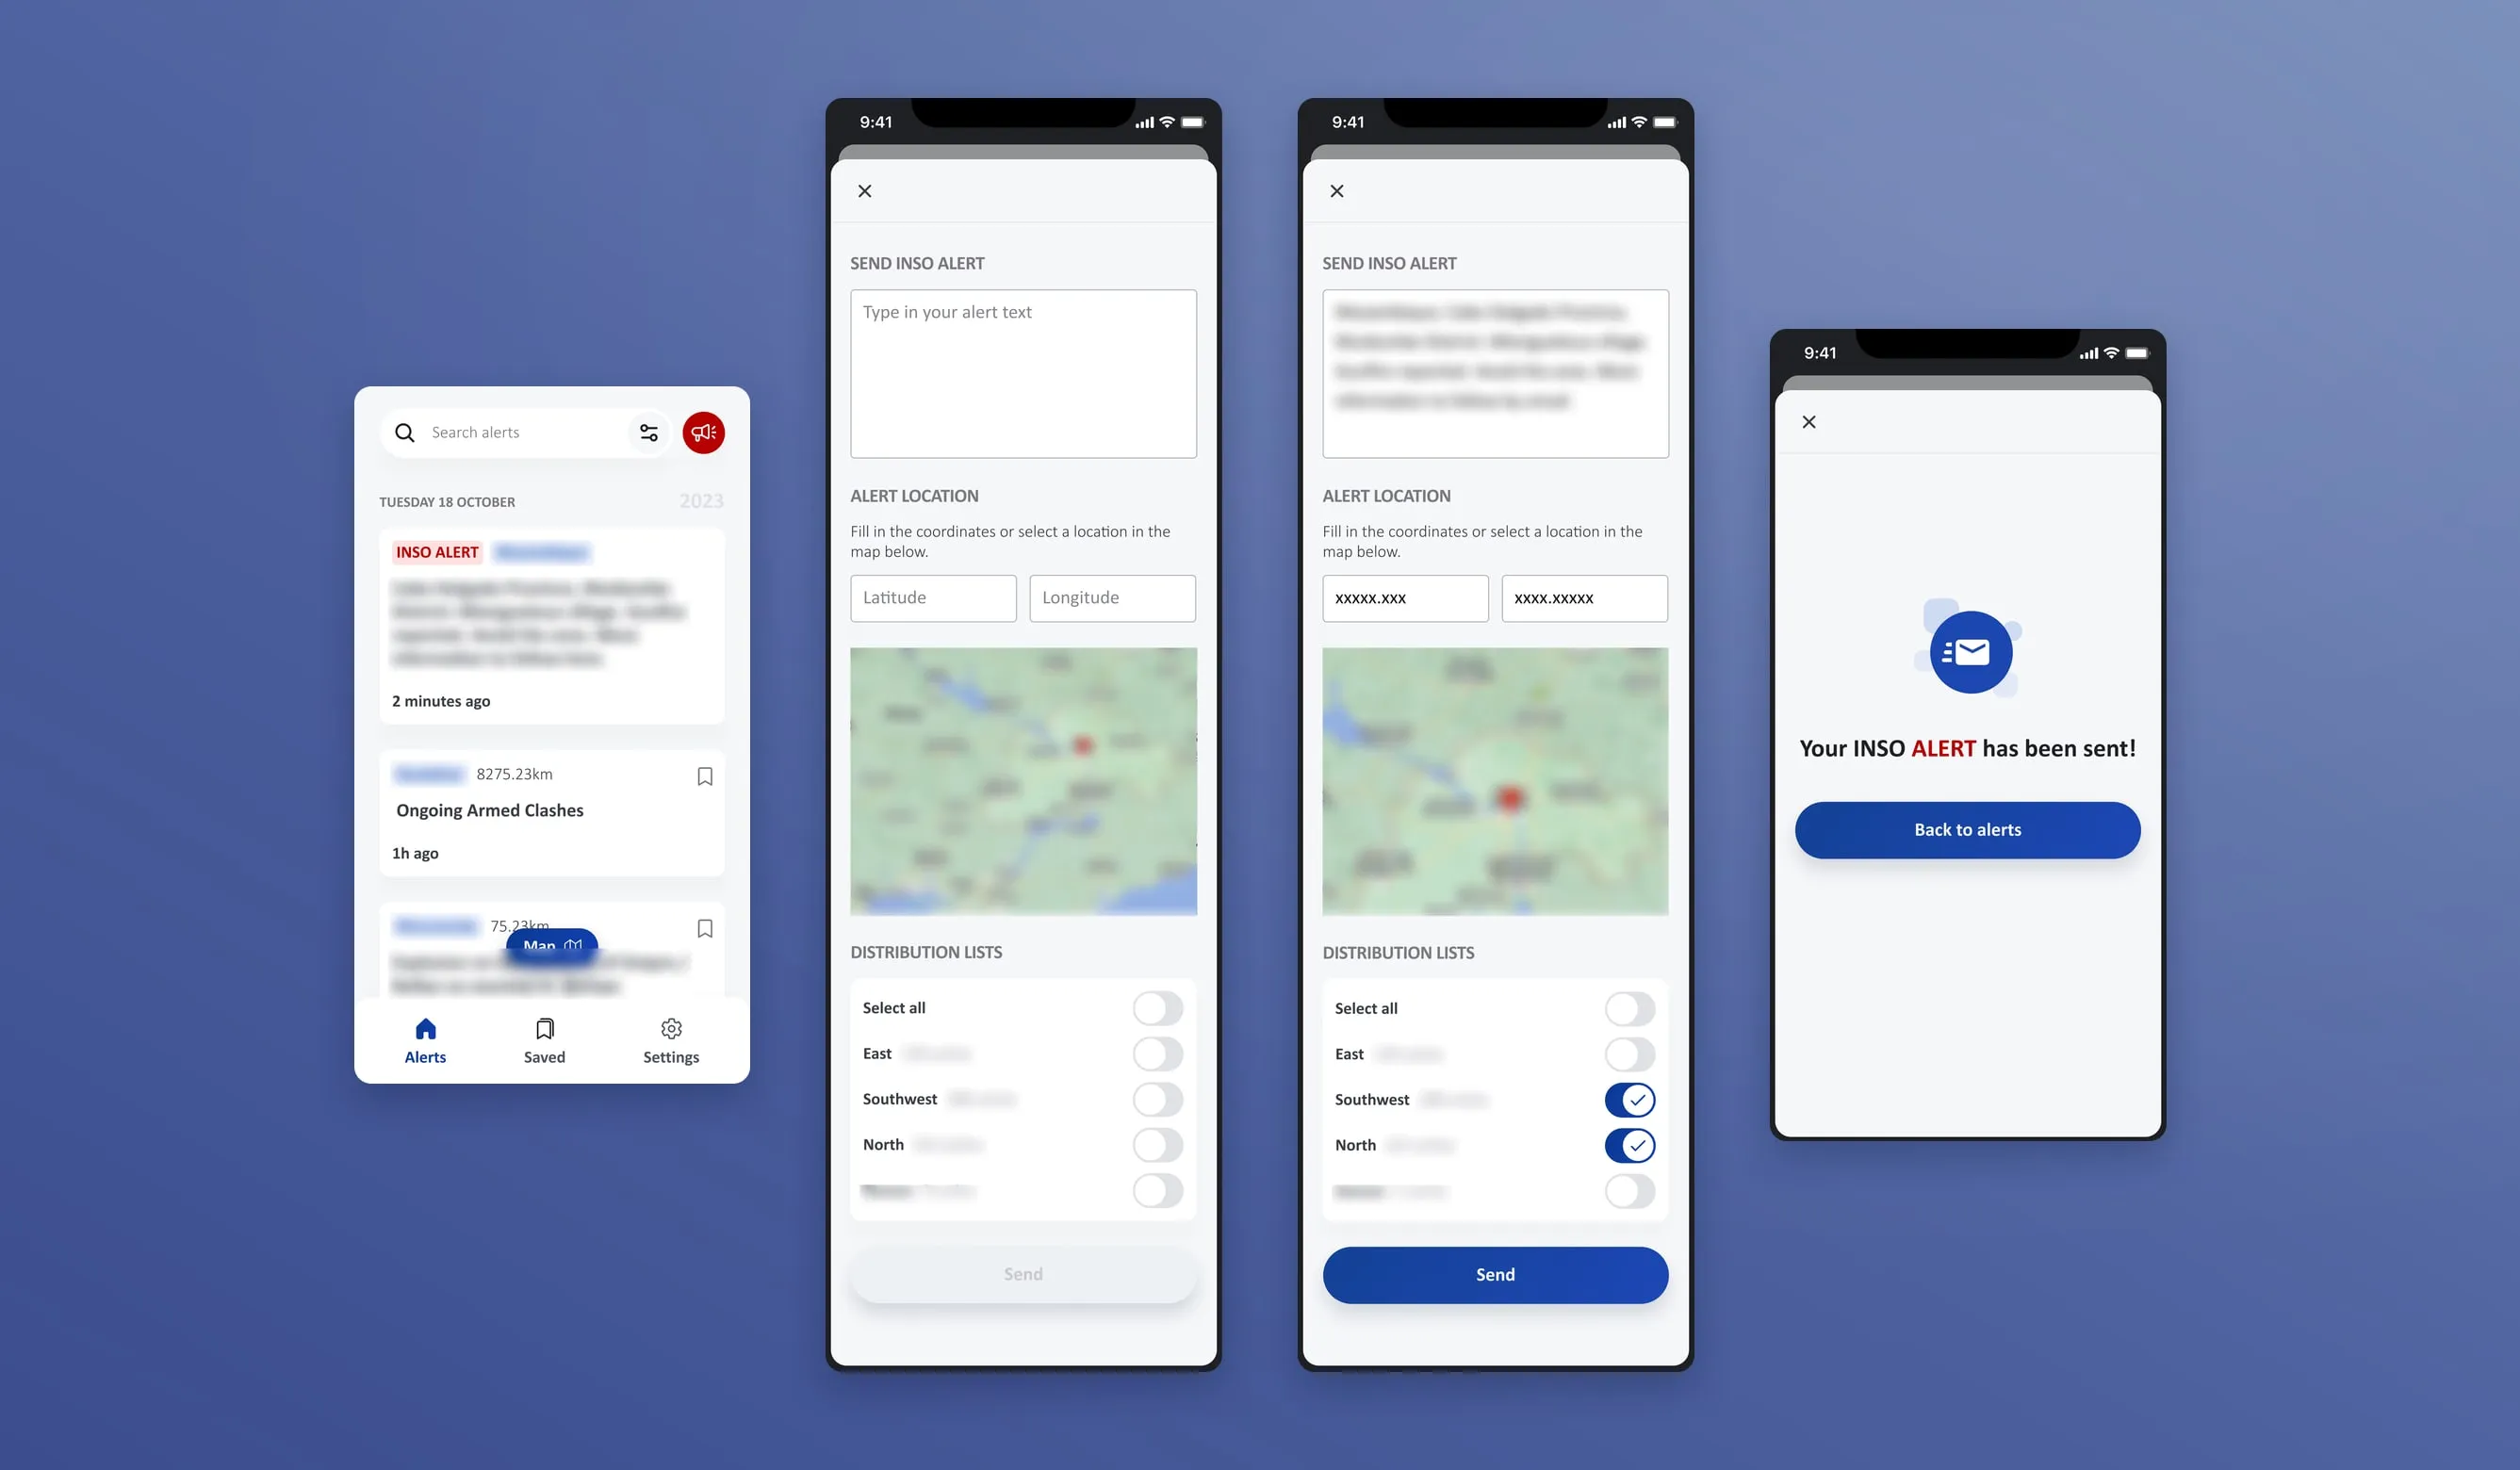
What about creating and sending alerts from the app?
This was part of the problem from the start, but we agreed to focus on the NGO side first. With management sign-off I designed the first version in early 2025, and it was released in September 2025 together with login through an INSO account: a simple form with a map pin and distribution lists, plus updates to existing alerts.
Outcome
How the app is used today
After the launch peak of about 1,600 users, a steady base settled in: around 800 a month through 2024, and 450 to 630 through 2026. About 8 in 10 of them are returning users, so most people who use it keep coming back.
Table view
| Month | Active users | Returning users |
|---|---|---|
| Jun 2023 | 1,630 | 1,160 |
| Jul 2023 | 1,270 | 1,080 |
| Aug 2023 | 1,000 | 900 |
| Sept 2023 | 890 | 800 |
| Oct 2023 | 870 | 780 |
| Nov 2023 | 830 | 770 |
| Dec 2023 | 900 | 760 |
| Jan 2024 | 860 | 740 |
| Feb 2024 | 820 | 730 |
| Mar 2024 | 780 | 700 |
| Apr 2024 | 800 | 700 |
| May 2024 | 790 | 670 |
| Jun 2024 | 810 | 690 |
| Jul 2024 | 760 | 660 |
| Aug 2024 | 720 | 620 |
| Sept 2024 | 840 | 680 |
| Oct 2024 | 740 | 630 |
| Nov 2024 | 740 | 630 |
| Dec 2024 | 740 | 650 |
| Jan 2025 | 730 | 640 |
| Feb 2025 | 690 | 600 |
| Mar 2025 | 710 | 630 |
| Apr 2025 | 700 | 620 |
| May 2025 | 680 | 580 |
| Jun 2025 | 660 | 580 |
| Jul 2025 | 740 | 630 |
| Aug 2025 | 690 | 590 |
| Sept 2025 | 650 | 530 |
| Oct 2025 | 640 | 530 |
| Nov 2025 | 530 | 470 |
| Dec 2025 | 500 | 420 |
| Jan 2026 | 480 | 400 |
| Feb 2026 | 480 | 410 |
| Mar 2026 | 530 | 440 |
| Apr 2026 | 500 | 420 |
| May 2026 | 460 | 400 |
| Jun 2026 | 460 | 380 |
| Jul 2026 | 460 | 370 |
| Aug 2026 | 450 | 380 |
| Sept 2026 | 630 | 450 |
Take a look at app.ngosafety.org (opens in a new tab)
What I can't say. Nothing was measured before the new design, so I can't say whether it made the app better, only that it's used and that people keep coming back.
In a post-launch survey of 31 partners, the 29 who rated ease of use gave it an average score of 4.1/5.
The weakest score was whether the app helped them reach their goal: 21 of 31 gave it a 4 or 5 (average 3.7), and a few said they hadn't really used it yet.
Takeaways
- Design for the worst connection first. Weak networks, stress and no time to learn shaped most decisions, from animated tutorials instead of video to a list you can scan in seconds.
- Test with proxies, then check with the real people. Country office colleagues before launch, partners after.
- Security and usability pull against each other. Blocking copy and screenshots keeps alerts safe, but partners named it their biggest frustration.
- Talk to every group early. The senders were left out of the first round and came back later as a patch.
- What I'd do differently: set baseline metrics before designing, run a proper retest of Geofence, and set up tracking before a feature ships.